The Looger Lab and the GENIE Project Team at HHMI Janelia have developed a new suite of jGCaMP8 calcium indicators, built on the GCaMP scaffold. The jGCaMP8 sensors have fast kinetics without compromising sensitivity, setting a new standard for in vivo imaging. Sensors that have been extensively tested in mammalian neurons in vivo and in vitro are:
- jGCaMP8f (fast): 4x faster rise time, 2.5x faster decay time than jGCaMP7f
- jGCaMP8m (medium): almost 4x faster rise time and 3.5x more sensitive than jGCaMP7f
- jGCaMP8s (sensitive): 2x more sensitive than jGCaMP7s, >2x faster than jGCaMP7f (at 1 AP)
The plasmids and AAVs are available on Addgene!
Transgenic mice are available at JAX. (Additional information and browsable histology)
Update (6/23/2021):
jGCaMP8-expressing flies are now available from The Bloomington Drosophila Stock Center. Search for "jGCaMP8" to see all available strains. See results of testing in Drosophila below.
AAV update (5/6/2021):
Addgene is currently handling the distribution of jGCaMP8 AAVs. See the latest list of available sensors/serotypes.
Jump to:
- Performance in Drosophila
- Performance in mouse visual cortex
- Cultured neuron screen performance
- Characterization in purified protein
- Ordering
- Citing our work
- Contact information
Performance in Drosophila
The jGCaMP8 sensors were imaged using a CCD camera (129 FPS) in the neuromuscular junction (NMJ) of larval Drosophila, using 470 nm excitation (panel a). Presynaptic boutons of motor neurons were stimulated at 1, 5, 10, and 20 Hz. Fluorescence responses of jGCaMP8f and jGCaMP8m (blue, red) at 10 and 20 Hz were dramatically more pronounced than jGCaMP7f (panel b).
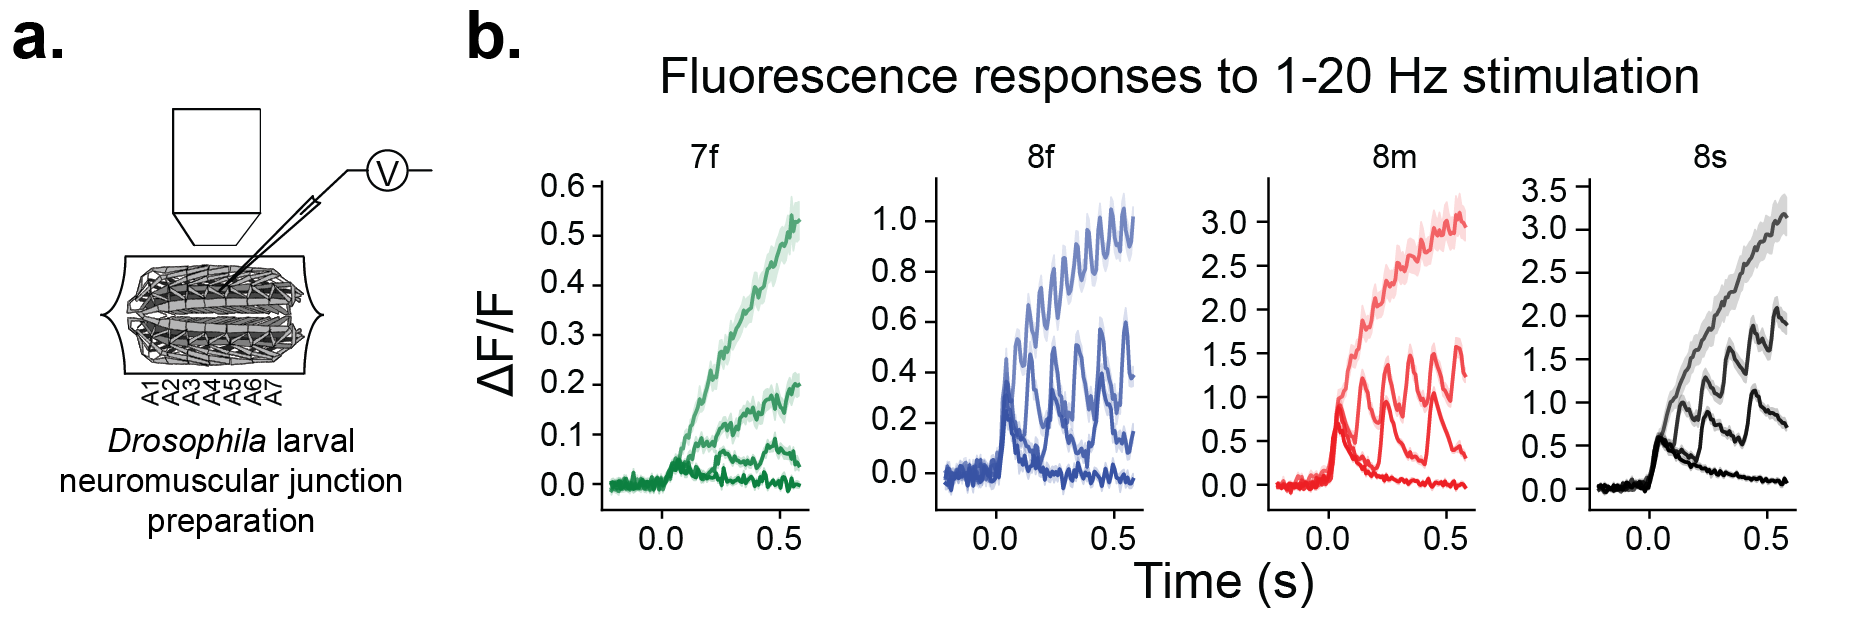
a. Experimental preparation: Stimulation of motor neuron with concurrent imaging of presynaptic boutons in fly larval NMJ. b . Averaged sensor responses. Shading represents stimulation frequency (from darkest to lightest frequencies are 1, 5, 10, 20hz).
We imaged jGCaMP8 and jGCaMP7f in Drosophila L2 neurons (panel a) with two-photon microscopy. These non-spiking neurons are part of the adult visual system and receive inputs directly from photoreceptors. The responses of jGCaMP8f and jGCaMP8m to long (1 s) as well as short (8 ms) dark flashes were faster and higher-amplitude than jGCaMP7f (panel b, c).
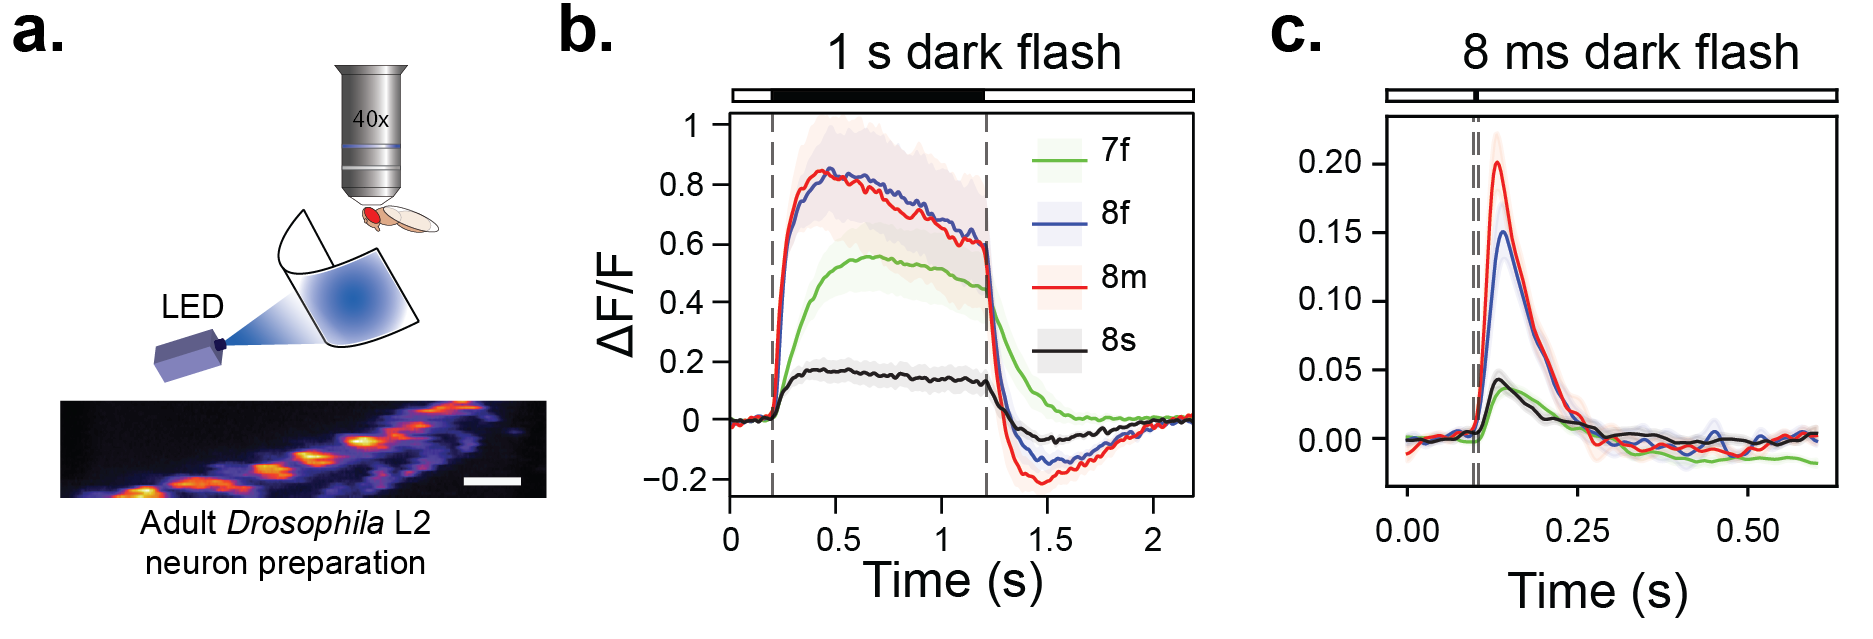
a. Experimental preparation: two-photon imaging of Drosophila L2 neurons during visual presentation of light flashes. b . Averaged responses of sensors to 1 s dark flashes. c. Averaged responses of sensors to 8 ms dark flashes.
- Note: in Drosophila, jGCaMP8 sensors exhibit a lower baseline fluorescence (F0) in all neuron types we tested. For testing in NMJ, we recommend using a secondary red marker, such as P{10XUAS-IVS-myr::tdTomato} to aid in identifying the neurons (see fluorescence compared to jGCaMP7f below). The secondary marker was not necessary to identify L2 neurons.
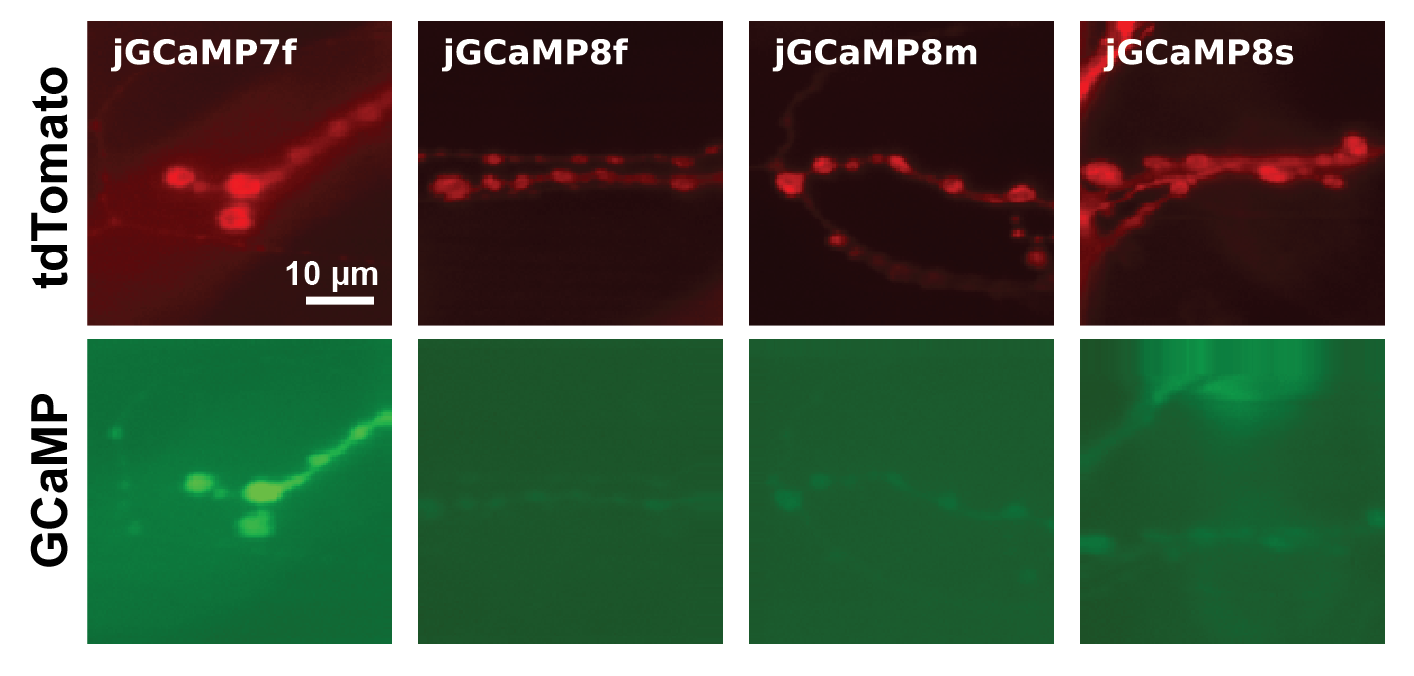
Comparative expression levels of jGCaMP8 and jGCaMP7f in fly NMJ. jGCaMP8 sensors tend to exhibit lower baseline fluorescence (GCaMP), necessitating the use of an additional red marker (tdTomato).
Performance in mouse visual cortex
Below are representative traces based on simultaneous fluorescence and cell-attached electrophysiology in mouse visual cortex. Small fields of view were imaged in vivo at effective time resolutions of 2 ms. Sensors tested in vivo are: AAV1-syn-jGCaMP7f-WPRE, AAV1-syn-jGCaMP8f-WPRE, AAV2-syn-jGCaMP8m-WPRE, AAV2-syn-jGCaMP8s-WPRE.
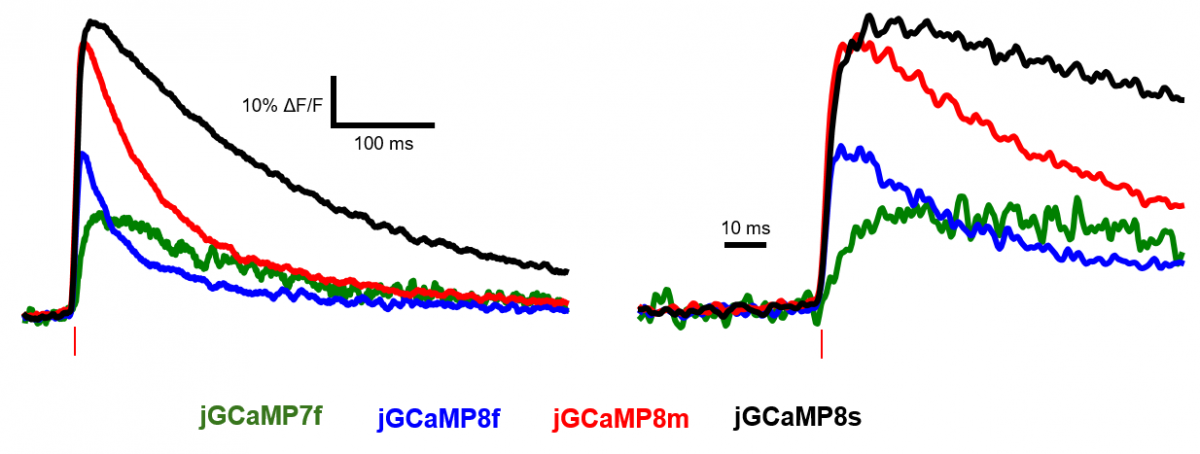
Grand average of calcium transients elicited by single action potentials in vivo, aligned to action potential peak (red bar), resampled at 500 Hz. Right: zoom-in to rise kinetics.
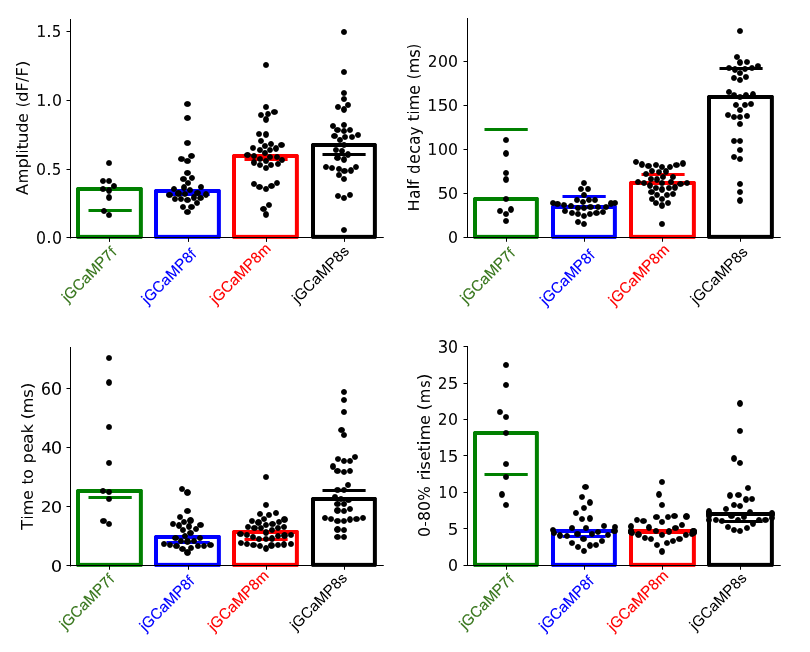
Cell-wise analysis of calcium transients elicited by single action potentials in vivo. Black dots represent single cells, bars represent median of single cells, horizontal lines represent values calculated from the grand averages (calculated from previous figure).
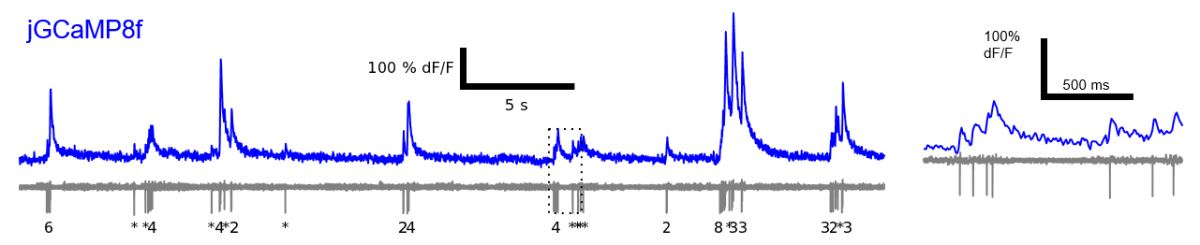
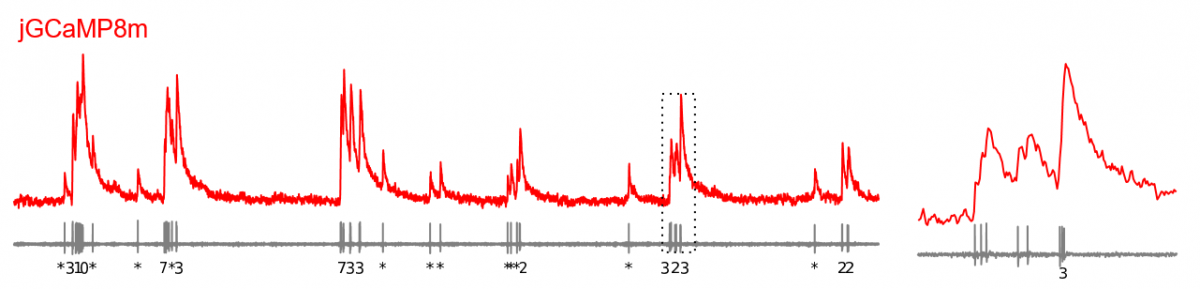
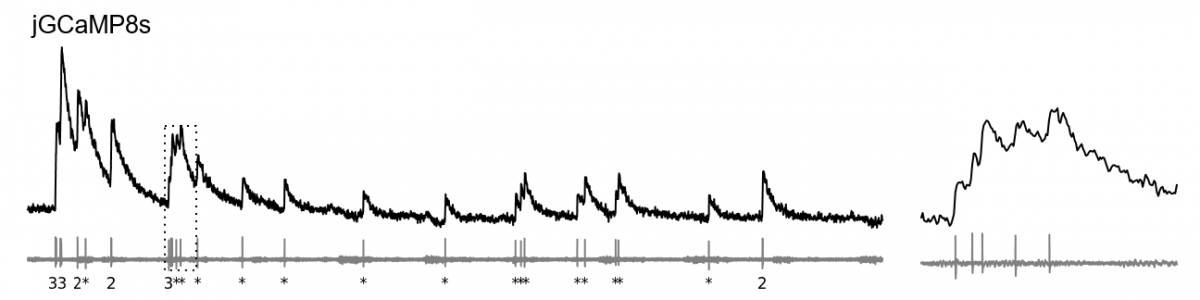
Representative in vivo ground truth recordings of GCaMP8 sensors. Fluorescence traces were filtered with a Gaussian filter (sigma = 5 ms).
Cell-attached recordings performed by Marton Rozsa (Svoboda lab).
Sample imaging sessions
jGCaMP8f
jGCaMP8m
jGCaMP8s
jGCaMP7f
Cultured neuron screen performance
The following table summarizes the sensitivity and kinetics of the jGCaMP8 sensors in the GENIE field stimulation-based cultured neuron screen.
| Max dF/F | Half-rise time (ms) | Time to peak (ms) | Half-decay time (ms) | |
|---|---|---|---|---|
| jGCaMP7f (control) | 0.21±0.1 | 24.8±6.6 | 99.5±30.2 | 181.9±76.0 |
| jGCaMP8f | 0.41±0.12 | 7.1±0.74 | 24.8±6.1 | 67.4±11.2 |
| jGCaMP8m | 0.76±0.22 | 7.1±0.61 | 29.0±11.2 | 118.3±13.2 |
| jGCaMP8s | 1.11±0.22 | 10.1±0.86 | 57.0±12.9 | 306.7±32.2 |
| jGCaMP8.712* | 0.66±0.18 | 10.9±1.24 | 41.6±8.1 | 94.8±13.3 |
* jGCaMP8.712 is currently being tested and may be released at a later date
The plots below show the averaged performance of the indicators. We compared the jGCaMP8 family of sensors to previous sensors from our group (GCaMP6, jGCaMP7) as well as the newly released XCaMP indicators.
This figure shows the mean (±s.e.m.) responses of the sensors to 1, 3, 10, and 160 APs at 80 Hz. Neurons were stimulated at t = 1 s.
The plots are interactive so you can do head-to-head comparisons with any sensors, zoom in, and download the plots. Double-click on a legend entry to isolate it.
This figure shows the sensitivity and kinetics of the sensors (mean ±s.e.m.). For panels labeled (norm.), the responses of the sensors at each stimulus are normalized to those of GCaMP6s.
The plots are interactive so you can do head-to-head comparisons with any sensors, zoom in, and download the plots. Double-click on a legend entry to isolate it.
Characterization in purified protein
The jGCaMP8 indicators were purified for in vitro characterization of affinity, kinetics, and absorption.
| Kd (nM) | Hill coeff. | Max dF/F | koff (fast) | koff (fast) % | koff (slow) | koff (slow) % | |
|---|---|---|---|---|---|---|---|
| jGCaMP7f (control) | 150±2 | 3.10±0.16 | 31.0±1.1 | 7.34±0.12 | |||
| jGCaMP8f | 334±18 | 2.08±0.22 | 78.8±9.7 | 37.03±0.75 | 91 | 1.37±3.49 | 9 |
| jGCaMP8m | 108±3 | 1.92±0.12 | 45.7±0.9 | 18.25±0.9 | |||
| jGCaMP8s | 46±1 | 2.20±0.13 | 49.5±0.1 | 3.68±0.1 | |||
| jGCaMP8.712* | 292±16 | 2.17±0.15 | 63.6±4.1 | 18.8±0.44 |
* jGCaMP8.712 is currently being tested and may be released at a later date
| pKa, apo | pKa, sat | ECsat(M-1 cm-1) | ECapo(M-1 cm-1) | |
|---|---|---|---|---|
| jGCaMP7f (control) | 8.68±0.13 | 6.71±0.06 | 52458 | 2783 |
| jGCaMP8f | 7.71±0.06 | 6.68±0.01 | 50759 | 1927 |
| jGCaMP8m | 7.40±0.02 | 6.68±0.07 | 49856 | 2249 |
| jGCaMP8s | 7.65±0.04 | 6.51±0.04 | 56960 | 2116 |
| jGCaMP8.712* | 9.01±0.13 | 6.83±0.06 | 41862 | 1358 |
* jGCaMP8.712 is currently being tested and may be released at a later date
Ordering
Order the jGCaMP8 plasmids and AAVs from Addgene here
Citing our work
A manuscript describing these GECIs is in preparation. In the meantime, these reagents and data are released pre-publication for your use. If you use these reagents in your work, please cite the following resource:
Contact
Questions? Contact GENIEreagents@janelia.hhmi.org