Filter
Associated Lab
- Aguilera Castrejon Lab (2) Apply Aguilera Castrejon Lab filter
- Ahrens Lab (57) Apply Ahrens Lab filter
- Aso Lab (42) Apply Aso Lab filter
- Baker Lab (19) Apply Baker Lab filter
- Betzig Lab (103) Apply Betzig Lab filter
- Beyene Lab (9) Apply Beyene Lab filter
- Bock Lab (14) Apply Bock Lab filter
- Branson Lab (51) Apply Branson Lab filter
- Card Lab (37) Apply Card Lab filter
- Cardona Lab (45) Apply Cardona Lab filter
- Chklovskii Lab (10) Apply Chklovskii Lab filter
- Clapham Lab (14) Apply Clapham Lab filter
- Cui Lab (19) Apply Cui Lab filter
- Darshan Lab (8) Apply Darshan Lab filter
- Dickson Lab (32) Apply Dickson Lab filter
- Druckmann Lab (21) Apply Druckmann Lab filter
- Dudman Lab (40) Apply Dudman Lab filter
- Eddy/Rivas Lab (30) Apply Eddy/Rivas Lab filter
- Egnor Lab (4) Apply Egnor Lab filter
- Espinosa Medina Lab (17) Apply Espinosa Medina Lab filter
- Feliciano Lab (10) Apply Feliciano Lab filter
- Fetter Lab (31) Apply Fetter Lab filter
- FIB-SEM Technology (1) Apply FIB-SEM Technology filter
- Fitzgerald Lab (16) Apply Fitzgerald Lab filter
- Freeman Lab (15) Apply Freeman Lab filter
- Funke Lab (42) Apply Funke Lab filter
- Gonen Lab (59) Apply Gonen Lab filter
- Grigorieff Lab (34) Apply Grigorieff Lab filter
- Harris Lab (54) Apply Harris Lab filter
- Heberlein Lab (13) Apply Heberlein Lab filter
- Hermundstad Lab (25) Apply Hermundstad Lab filter
- Hess Lab (76) Apply Hess Lab filter
- Ilanges Lab (2) Apply Ilanges Lab filter
- Jayaraman Lab (43) Apply Jayaraman Lab filter
- Ji Lab (33) Apply Ji Lab filter
- Johnson Lab (1) Apply Johnson Lab filter
- Karpova Lab (13) Apply Karpova Lab filter
- Keleman Lab (8) Apply Keleman Lab filter
- Keller Lab (61) Apply Keller Lab filter
- Koay Lab (2) Apply Koay Lab filter
- Lavis Lab (142) Apply Lavis Lab filter
- Lee (Albert) Lab (29) Apply Lee (Albert) Lab filter
- Leonardo Lab (19) Apply Leonardo Lab filter
- Li Lab (6) Apply Li Lab filter
- Lippincott-Schwartz Lab (106) Apply Lippincott-Schwartz Lab filter
- Liu (Yin) Lab (2) Apply Liu (Yin) Lab filter
- Liu (Zhe) Lab (59) Apply Liu (Zhe) Lab filter
- Looger Lab (137) Apply Looger Lab filter
- Magee Lab (31) Apply Magee Lab filter
- Menon Lab (12) Apply Menon Lab filter
- Murphy Lab (6) Apply Murphy Lab filter
- O'Shea Lab (6) Apply O'Shea Lab filter
- Otopalik Lab (1) Apply Otopalik Lab filter
- Pachitariu Lab (37) Apply Pachitariu Lab filter
- Pastalkova Lab (5) Apply Pastalkova Lab filter
- Pavlopoulos Lab (7) Apply Pavlopoulos Lab filter
- Pedram Lab (4) Apply Pedram Lab filter
- Podgorski Lab (16) Apply Podgorski Lab filter
- Reiser Lab (47) Apply Reiser Lab filter
- Riddiford Lab (20) Apply Riddiford Lab filter
- Romani Lab (37) Apply Romani Lab filter
- Rubin Lab (109) Apply Rubin Lab filter
- Saalfeld Lab (47) Apply Saalfeld Lab filter
- Satou Lab (1) Apply Satou Lab filter
- Scheffer Lab (38) Apply Scheffer Lab filter
- Schreiter Lab (51) Apply Schreiter Lab filter
- Sgro Lab (1) Apply Sgro Lab filter
- Shroff Lab (31) Apply Shroff Lab filter
- Simpson Lab (18) Apply Simpson Lab filter
- Singer Lab (37) Apply Singer Lab filter
- Spruston Lab (61) Apply Spruston Lab filter
- Stern Lab (75) Apply Stern Lab filter
- Sternson Lab (47) Apply Sternson Lab filter
- Stringer Lab (36) Apply Stringer Lab filter
- Svoboda Lab (131) Apply Svoboda Lab filter
- Tebo Lab (11) Apply Tebo Lab filter
- Tervo Lab (9) Apply Tervo Lab filter
- Tillberg Lab (18) Apply Tillberg Lab filter
- Tjian Lab (17) Apply Tjian Lab filter
- Truman Lab (58) Apply Truman Lab filter
- Turaga Lab (41) Apply Turaga Lab filter
- Turner Lab (28) Apply Turner Lab filter
- Vale Lab (8) Apply Vale Lab filter
- Voigts Lab (3) Apply Voigts Lab filter
- Wang (Meng) Lab (27) Apply Wang (Meng) Lab filter
- Wang (Shaohe) Lab (6) Apply Wang (Shaohe) Lab filter
- Wu Lab (8) Apply Wu Lab filter
- Zlatic Lab (26) Apply Zlatic Lab filter
- Zuker Lab (5) Apply Zuker Lab filter
Associated Project Team
- CellMap (12) Apply CellMap filter
- COSEM (3) Apply COSEM filter
- FIB-SEM Technology (5) Apply FIB-SEM Technology filter
- Fly Descending Interneuron (12) Apply Fly Descending Interneuron filter
- Fly Functional Connectome (14) Apply Fly Functional Connectome filter
- Fly Olympiad (5) Apply Fly Olympiad filter
- FlyEM (56) Apply FlyEM filter
- FlyLight (50) Apply FlyLight filter
- GENIE (47) Apply GENIE filter
- Integrative Imaging (7) Apply Integrative Imaging filter
- Larval Olympiad (2) Apply Larval Olympiad filter
- MouseLight (18) Apply MouseLight filter
- NeuroSeq (1) Apply NeuroSeq filter
- ThalamoSeq (1) Apply ThalamoSeq filter
- Tool Translation Team (T3) (28) Apply Tool Translation Team (T3) filter
- Transcription Imaging (45) Apply Transcription Imaging filter
Associated Support Team
- Project Pipeline Support (5) Apply Project Pipeline Support filter
- Anatomy and Histology (18) Apply Anatomy and Histology filter
- Cryo-Electron Microscopy (41) Apply Cryo-Electron Microscopy filter
- Electron Microscopy (18) Apply Electron Microscopy filter
- Gene Targeting and Transgenics (11) Apply Gene Targeting and Transgenics filter
- High Performance Computing (7) Apply High Performance Computing filter
- Integrative Imaging (18) Apply Integrative Imaging filter
- Invertebrate Shared Resource (40) Apply Invertebrate Shared Resource filter
- Janelia Experimental Technology (37) Apply Janelia Experimental Technology filter
- Management Team (1) Apply Management Team filter
- Mass Spectrometry (1) Apply Mass Spectrometry filter
- Molecular Genomics (15) Apply Molecular Genomics filter
- Primary & iPS Cell Culture (14) Apply Primary & iPS Cell Culture filter
- Project Technical Resources (51) Apply Project Technical Resources filter
- Quantitative Genomics (20) Apply Quantitative Genomics filter
- Scientific Computing (98) Apply Scientific Computing filter
- Viral Tools (14) Apply Viral Tools filter
- Vivarium (7) Apply Vivarium filter
Publication Date
- 2025 (219) Apply 2025 filter
- 2024 (211) Apply 2024 filter
- 2023 (157) Apply 2023 filter
- 2022 (166) Apply 2022 filter
- 2021 (175) Apply 2021 filter
- 2020 (177) Apply 2020 filter
- 2019 (177) Apply 2019 filter
- 2018 (206) Apply 2018 filter
- 2017 (186) Apply 2017 filter
- 2016 (191) Apply 2016 filter
- 2015 (195) Apply 2015 filter
- 2014 (190) Apply 2014 filter
- 2013 (136) Apply 2013 filter
- 2012 (112) Apply 2012 filter
- 2011 (98) Apply 2011 filter
- 2010 (61) Apply 2010 filter
- 2009 (56) Apply 2009 filter
- 2008 (40) Apply 2008 filter
- 2007 (21) Apply 2007 filter
- 2006 (3) Apply 2006 filter
2777 Janelia Publications
Showing 1301-1310 of 2777 results
We introduce a method for optically imaging intracellular proteins at nanometer spatial resolution. Numerous sparse subsets of photoactivatable fluorescent protein molecules were activated, localized (to approximately 2 to 25 nanometers), and then bleached. The aggregate position information from all subsets was then assembled into a superresolution image. We used this method–termed photoactivated localization microscopy–to image specific target proteins in thin sections of lysosomes and mitochondria; in fixed whole cells, we imaged vinculin at focal adhesions, actin within a lamellipodium, and the distribution of the retroviral protein Gag at the plasma membrane.
Commentary: The original PALM paper by myself and my friend and co-inventor Harald Hess, spanning the before- and after-HHMI eras. Submitted and publicly presented months before other publications in the same year, the lessons of the paper remain widely misunderstood: 1) localization precision is not resolution; 2) the ability to resolve a few molecules by the Rayleigh criterion in a diffraction limited region (DLR) does not imply the ability to resolve structures of arbitrary complexity at the same scale; 3) true resolution well beyond the Abbe limit requires the ability to isolate and localize hundreds or thousands of molecules in one DLR; and 4) certain photoactivatable fluorescent proteins (PA-FPs) and caged dyes can be isolated and precisely localized at such densities; yielding true resolution down to 20 nm. The molecular densities we demonstrate (105 molecules/m2) are more than two orders of magnitude greater than in later papers that year (implying ten-fold better true resolution) – indeed, these papers demonstrate densities only comparable to earlier spectral or photobleaching based isolation methods. We validate our claims by correlative electron microscopy, and demonstrate the outstanding advantages of PA-FPs for superresolution microscopy: minimally perturbative sample preparation; high labeling densities; close binding to molecular targets; and zero non-specific background.
Decoding the wiring diagram of the retina requires simultaneous observation of activity in identified neuron populations. Available recording methods are limited in their scope: electrodes can access only a small fraction of neurons at once, whereas synthetic fluorescent indicator dyes label tissue indiscriminately. Here, we describe a method for studying retinal circuitry at cellular and subcellular levels combining two-photon microscopy and a genetically encoded calcium indicator. Using specific viral and promoter constructs to drive expression of GCaMP3, we labeled all five major neuron classes in the adult mouse retina. Stimulus-evoked GCaMP3 responses as imaged by two-photon microscopy permitted functional cell type annotation. Fluorescence responses were similar to those measured with the small molecule dye OGB-1. Fluorescence intensity correlated linearly with spike rates >10 spikes/s, and a significant change in fluorescence always reflected a significant change in spike firing rate. GCaMP3 expression had no apparent effect on neuronal function. Imaging at subcellular resolution showed compartment-specific calcium dynamics in multiple identified cell types.
Observation of molecular processes inside living cells is fundamental to a quantitative understanding of how biological systems function. Specifically, decoding the complex behavior of single molecules enables us to measure kinetics, transport, and self-assembly at this fundamental level that is often veiled in ensemble experiments. In the past decade, rapid developments in fluorescence microscopy, fluorescence correlation spectroscopy, and fluorescent labeling techniques have enabled new experiments to investigate the robustness and stochasticity of diverse molecular mechanisms with high spatiotemporal resolution. This review discusses the concepts and strategies of structural and functional imaging in living cells at the single-molecule level with minimal perturbations to the specimen.

Morphogenesis, the development of the shape of an organism, is a dynamic process on a multitude of scales, from fast subcellular rearrangements and cell movements to slow structural changes at the whole-organism level. Live-imaging approaches based on light microscopy reveal the intricate dynamics of this process and are thus indispensable for investigating the underlying mechanisms. This Review discusses emerging imaging techniques that can record morphogenesis at temporal scales from seconds to days and at spatial scales from hundreds of nanometers to several millimeters. To unlock their full potential, these methods need to be matched with new computational approaches and physical models that help convert highly complex image data sets into biological insights.
RNA-protein interactions are essential for proper gene expression regulation, particularly in neurons with unique spatial constraints. Currently, these interactions are defined biochemically, but a method is needed to evaluate them quantitatively within morphological context. Colocalization of two-color labels using wide-field microscopy is a method to infer these interactions. However, because of chromatic aberrations in the objective lens, this approach lacks the resolution to determine whether two molecules are physically in contact or simply nearby by chance. Here, we developed a robust super registration methodology that corrected the chromatic aberration across the entire image field to within 10 nm, which is capable of determining whether two molecules are physically interacting or simply in proximity by random chance. We applied this approach to image single-molecule FISH in combination with immunofluorescence (smFISH-IF) and determined whether the association between an mRNA and binding protein(s) within a neuron was significant or accidental. We evaluated several mRNA-binding proteins identified from RNA pulldown assays to determine which of these exhibit bona fide interactions. Surprisingly, many known mRNA-binding proteins did not bind the mRNA in situ, indicating that adventitious interactions are significant using existing technology. This method provides an ability to evaluate two-color registration compatible with the scale of molecular interactions.
RNA is the fundamental information transfer system in the cell. The ability to follow single messenger RNAs (mRNAs) from transcription to degradation with fluorescent probes gives quantitative information about how the information is transferred from DNA to proteins. This review focuses on the latest technological developments in the field of single-mRNA detection and their usage to study gene expression in both fixed and live cells. By describing the application of these imaging tools, we follow the journey of mRNA from transcription to decay in single cells, with single-molecule resolution. We review current theoretical models for describing transcription and translation that were generated by single-molecule and single-cell studies. These methods provide a basis to study how single-molecule interactions generate phenotypes, fundamentally changing our understating of gene expression regulation.
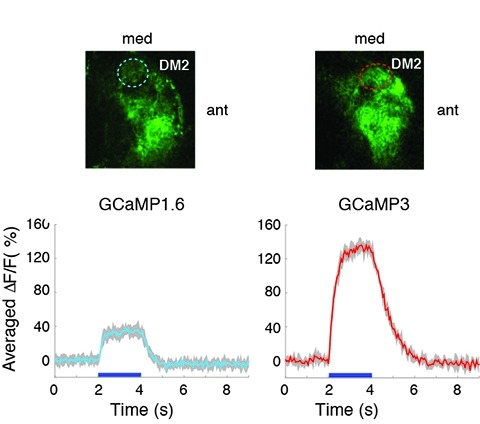
Genetically encoded calcium indicators (GECIs) can be used to image activity in defined neuronal populations. However, current GECIs produce inferior signals compared to synthetic indicators and recording electrodes, precluding detection of low firing rates. We developed a single-wavelength GCaMP2-based GECI (GCaMP3), with increased baseline fluorescence (3-fold), increased dynamic range (3-fold) and higher affinity for calcium (1.3-fold). We detected GCaMP3 fluorescence changes triggered by single action potentials in pyramidal cell dendrites, with signal-to-noise ratio and photostability substantially better than those of GCaMP2, D3cpVenus and TN-XXL. In Caenorhabditis elegans chemosensory neurons and the Drosophila melanogaster antennal lobe, sensory stimulation-evoked fluorescence responses were significantly enhanced with GCaMP3 (4-6-fold). In somatosensory and motor cortical neurons in the intact mouse, GCaMP3 detected calcium transients with amplitudes linearly dependent on action potential number. Long-term imaging in the motor cortex of behaving mice revealed large fluorescence changes in imaged neurons over months.
The ability to chronically monitor neuronal activity in the living brain is essential for understanding the organization and function of the nervous system. The genetically encoded green fluorescent protein based calcium sensor GCaMP provides a powerful tool for detecting calcium transients in neuronal somata, processes, and synapses that are triggered by neuronal activities. Here we report the generation and characterization of transgenic mice that express improved GCaMPs in various neuronal subpopulations under the control of the Thy1 promoter. In vitro and in vivo studies show that calcium transients induced by spontaneous and stimulus-evoked neuronal activities can be readily detected at the level of individual cells and synapses in acute brain slices, as well as in awake behaving animals. These GCaMP transgenic mice allow investigation of activity patterns in defined neuronal populations in the living brain, and will greatly facilitate dissecting complex structural and functional relationships of neural networks.
Genetically encoded calcium indicators (GECIs), which are based on chimeric fluorescent proteins, can be used to monitor calcium transients in living cells and organisms. Because they are encoded by DNA, GECIs can be delivered to the intact brain noninvasively and targeted to defined populations of neurons and specific subcellular compartments for long-term, repeated measurements in vivo. GECIs have improved iteratively and are becoming useful for imaging neural activity in vivo. Here we summarize extrinsic and intrinsic factors that influence a GECI's performance and provides guidelines for selecting the appropriate GECI for a given application. We also review recent progress in GECI design, optimization, and standardized testing protocols.
Understanding the neural correlates of behavior in the mammalian cortex requires measurements of activity in awake, behaving animals. Rodents have emerged as a powerful model for dissecting the cortical circuits underlying behavior attributable to the convergence of several methods. Genetically encoded calcium indicators combined with viral-mediated or transgenic tools enable chronic monitoring of calcium signals in neuronal populations and subcellular structures of identified cell types. Stable one- and two-photon imaging of neuronal activity in awake, behaving animals is now possible using new behavioral paradigms in head-fixed animals, or using novel miniature head-mounted microscopes in freely moving animals. This mini-symposium will highlight recent applications of these methods for studying sensorimotor integration, decision making, learning, and memory in cortical and subcortical brain areas. We will outline future prospects and challenges for identifying the neural underpinnings of task-dependent behavior using cellular imaging in rodents.