Main Menu (Mobile)- Block
Main Menu - Block
Keller Research Gallery
Automated detection of cell divisions (magenta) in the syncytial blastoderm of a Drosophila embryo. The figure shows snapshots of the final mitotic wave as it travels through the 500-µm-long embryo within a few minutes. Each sphere corresponds to one cell nucleus. By the end of the wave the embryo consists of about 6,000 cells. The data set was recorded with simultaneous multiview light-sheet microscopy (SiMView).
CREDIT: Tomer, Khairy, Amat and Keller, 2012, Nature Methods.
Simultaneous multi-view light sheet microscopy accurately records fast cellular dynamics in large multi-cellular organisms.
CREDIT: Tomer, Khairy, Amat and Keller, 2012, Nature Methods.
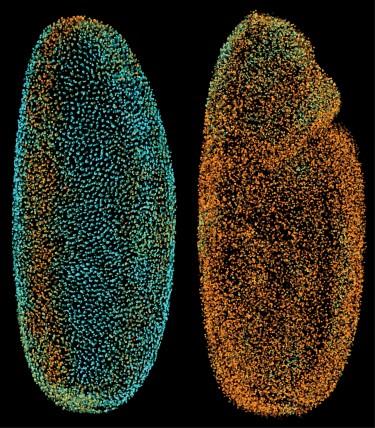
Snapshots of the Drosophila Digital Embryo: The colored spheres indicate nuclear positions in the entire embryo at time points 3.2 (left) and 4.9 (right) hours post fertilization. Nuclear positions were automatically detected from a DSLM-SI time-lapse recording of a histone-eGFP labeled wild-type embryo. Colors encode local average movement speeds (cyan to orange, 0-0.8 µm min-1).
CREDIT: Keller et al. 2010, Nature Methods.
Head close-up of a young Medaka fish: The image was recorded with a Digital Scanned Laser Light Sheet Fluorescence Microscope (DSLM). The acetylated tubulin immuno-staining shows (from right to left) forebrain, retina of the right eye, midbrain and hindbrain at the age of 4 days.
CREDIT: Keller et al. 2008, Science.
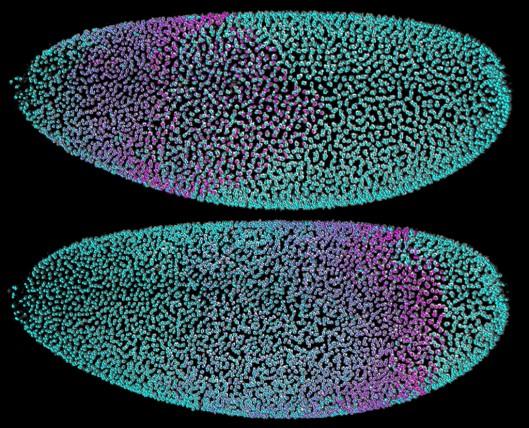
Automated cell tracking in the syncytial blastoderm of a Drosophila embryo. The top and bottom panels show all of the embryo’s cell nuclei at 95 and 147 minutes post fertilization. Colors were randomly assigned in the first time point and subsequently propagated to daughter cells after cell division, using automated approaches to computational image analysis. The data set was recorded with simultaneous multiview light-sheet microscopy.
CREDIT: Tomer, Khairy, Amat and Keller, 2012, Nature Methods.
Full body shots of a Medaka juvenile: The 10-day-old specimen was recorded from multiple views with a Digital Scanned Laser Light Sheet Fluorescence Microscope (DSLM). The acetylated tubulin immuno-staining shows the developing brain and spinal cord of the approximately 5 mm long fish juvenile.
CREDIT: Keller et al. 2008, Science.
Automated cell tracking in the Zebrafish Digital Embryo: The images show a montage of DSLM microscopy data (right half of embryo: animal view, maximum-intensity projection) and the Digital Embryo (left half of embryo) with color-encoded cell migration directions. Color code: dorsal migration (cyan), ventral migration (green), toward or away from body axis (red or yellow), toward yolk (pink).
CREDIT: Keller et al. 2008, Science.