Filter
Associated Lab
- Aguilera Castrejon Lab (1) Apply Aguilera Castrejon Lab filter
- Ahrens Lab (53) Apply Ahrens Lab filter
- Aso Lab (40) Apply Aso Lab filter
- Baker Lab (19) Apply Baker Lab filter
- Betzig Lab (101) Apply Betzig Lab filter
- Beyene Lab (8) Apply Beyene Lab filter
- Bock Lab (14) Apply Bock Lab filter
- Branson Lab (50) Apply Branson Lab filter
- Card Lab (36) Apply Card Lab filter
- Cardona Lab (45) Apply Cardona Lab filter
- Chklovskii Lab (10) Apply Chklovskii Lab filter
- Clapham Lab (14) Apply Clapham Lab filter
- Cui Lab (19) Apply Cui Lab filter
- Darshan Lab (8) Apply Darshan Lab filter
- Dickson Lab (32) Apply Dickson Lab filter
- Druckmann Lab (21) Apply Druckmann Lab filter
- Dudman Lab (38) Apply Dudman Lab filter
- Eddy/Rivas Lab (30) Apply Eddy/Rivas Lab filter
- Egnor Lab (4) Apply Egnor Lab filter
- Espinosa Medina Lab (15) Apply Espinosa Medina Lab filter
- Feliciano Lab (7) Apply Feliciano Lab filter
- Fetter Lab (31) Apply Fetter Lab filter
- Fitzgerald Lab (16) Apply Fitzgerald Lab filter
- Freeman Lab (15) Apply Freeman Lab filter
- Funke Lab (38) Apply Funke Lab filter
- Gonen Lab (59) Apply Gonen Lab filter
- Grigorieff Lab (34) Apply Grigorieff Lab filter
- Harris Lab (53) Apply Harris Lab filter
- Heberlein Lab (13) Apply Heberlein Lab filter
- Hermundstad Lab (23) Apply Hermundstad Lab filter
- Hess Lab (74) Apply Hess Lab filter
- Ilanges Lab (2) Apply Ilanges Lab filter
- Jayaraman Lab (42) Apply Jayaraman Lab filter
- Ji Lab (33) Apply Ji Lab filter
- Johnson Lab (1) Apply Johnson Lab filter
- Karpova Lab (13) Apply Karpova Lab filter
- Keleman Lab (8) Apply Keleman Lab filter
- Keller Lab (61) Apply Keller Lab filter
- Koay Lab (2) Apply Koay Lab filter
- Lavis Lab (137) Apply Lavis Lab filter
- Lee (Albert) Lab (29) Apply Lee (Albert) Lab filter
- Leonardo Lab (19) Apply Leonardo Lab filter
- Li Lab (4) Apply Li Lab filter
- Lippincott-Schwartz Lab (97) Apply Lippincott-Schwartz Lab filter
- Liu (Yin) Lab (1) Apply Liu (Yin) Lab filter
- Liu (Zhe) Lab (58) Apply Liu (Zhe) Lab filter
- Looger Lab (137) Apply Looger Lab filter
- Magee Lab (31) Apply Magee Lab filter
- Menon Lab (12) Apply Menon Lab filter
- Murphy Lab (6) Apply Murphy Lab filter
- O'Shea Lab (6) Apply O'Shea Lab filter
- Otopalik Lab (1) Apply Otopalik Lab filter
- Pachitariu Lab (36) Apply Pachitariu Lab filter
- Pastalkova Lab (5) Apply Pastalkova Lab filter
- Pavlopoulos Lab (7) Apply Pavlopoulos Lab filter
- Pedram Lab (4) Apply Pedram Lab filter
- Podgorski Lab (16) Apply Podgorski Lab filter
- Reiser Lab (45) Apply Reiser Lab filter
- Riddiford Lab (20) Apply Riddiford Lab filter
- Romani Lab (31) Apply Romani Lab filter
- Rubin Lab (105) Apply Rubin Lab filter
- Saalfeld Lab (46) Apply Saalfeld Lab filter
- Satou Lab (1) Apply Satou Lab filter
- Scheffer Lab (36) Apply Scheffer Lab filter
- Schreiter Lab (50) Apply Schreiter Lab filter
- Sgro Lab (1) Apply Sgro Lab filter
- Shroff Lab (31) Apply Shroff Lab filter
- Simpson Lab (18) Apply Simpson Lab filter
- Singer Lab (37) Apply Singer Lab filter
- Spruston Lab (57) Apply Spruston Lab filter
- Stern Lab (73) Apply Stern Lab filter
- Sternson Lab (47) Apply Sternson Lab filter
- Stringer Lab (32) Apply Stringer Lab filter
- Svoboda Lab (131) Apply Svoboda Lab filter
- Tebo Lab (9) Apply Tebo Lab filter
- Tervo Lab (9) Apply Tervo Lab filter
- Tillberg Lab (18) Apply Tillberg Lab filter
- Tjian Lab (17) Apply Tjian Lab filter
- Truman Lab (58) Apply Truman Lab filter
- Turaga Lab (39) Apply Turaga Lab filter
- Turner Lab (27) Apply Turner Lab filter
- Vale Lab (7) Apply Vale Lab filter
- Voigts Lab (3) Apply Voigts Lab filter
- Wang (Meng) Lab (21) Apply Wang (Meng) Lab filter
- Wang (Shaohe) Lab (6) Apply Wang (Shaohe) Lab filter
- Wu Lab (8) Apply Wu Lab filter
- Zlatic Lab (26) Apply Zlatic Lab filter
- Zuker Lab (5) Apply Zuker Lab filter
Associated Project Team
- CellMap (12) Apply CellMap filter
- COSEM (3) Apply COSEM filter
- FIB-SEM Technology (3) Apply FIB-SEM Technology filter
- Fly Descending Interneuron (11) Apply Fly Descending Interneuron filter
- Fly Functional Connectome (14) Apply Fly Functional Connectome filter
- Fly Olympiad (5) Apply Fly Olympiad filter
- FlyEM (53) Apply FlyEM filter
- FlyLight (49) Apply FlyLight filter
- GENIE (46) Apply GENIE filter
- Integrative Imaging (4) Apply Integrative Imaging filter
- Larval Olympiad (2) Apply Larval Olympiad filter
- MouseLight (18) Apply MouseLight filter
- NeuroSeq (1) Apply NeuroSeq filter
- ThalamoSeq (1) Apply ThalamoSeq filter
- Tool Translation Team (T3) (26) Apply Tool Translation Team (T3) filter
- Transcription Imaging (45) Apply Transcription Imaging filter
Publication Date
- 2025 (126) Apply 2025 filter
- 2024 (215) Apply 2024 filter
- 2023 (159) Apply 2023 filter
- 2022 (167) Apply 2022 filter
- 2021 (175) Apply 2021 filter
- 2020 (177) Apply 2020 filter
- 2019 (177) Apply 2019 filter
- 2018 (206) Apply 2018 filter
- 2017 (186) Apply 2017 filter
- 2016 (191) Apply 2016 filter
- 2015 (195) Apply 2015 filter
- 2014 (190) Apply 2014 filter
- 2013 (136) Apply 2013 filter
- 2012 (112) Apply 2012 filter
- 2011 (98) Apply 2011 filter
- 2010 (61) Apply 2010 filter
- 2009 (56) Apply 2009 filter
- 2008 (40) Apply 2008 filter
- 2007 (21) Apply 2007 filter
- 2006 (3) Apply 2006 filter
Type of Publication
- Remove Janelia filter Janelia
2691 Publications
Showing 2161-2170 of 2691 resultsPfam, available via servers in the UK (http://pfam.sanger.ac.uk/) and the USA (http://pfam.janelia.org/), is a widely used database of protein families, containing 14 831 manually curated entries in the current release, version 27.0. Since the last update article 2 years ago, we have generated 1182 new families and maintained sequence coverage of the UniProt Knowledgebase (UniProtKB) at nearly 80%, despite a 50% increase in the size of the underlying sequence database. Since our 2012 article describing Pfam, we have also undertaken a comprehensive review of the features that are provided by Pfam over and above the basic family data. For each feature, we determined the relevance, computational burden, usage statistics and the functionality of the feature in a website context. As a consequence of this review, we have removed some features, enhanced others and developed new ones to meet the changing demands of computational biology. Here, we describe the changes to Pfam content. Notably, we now provide family alignments based on four different representative proteome sequence data sets and a new interactive DNA search interface. We also discuss the mapping between Pfam and known 3D structures.
View Publication PageThe mouse is an increasingly prominent model for the analysis of mammalian neuronal circuits. Neural circuits ultimately have to be probed during behaviors that engage the circuits. Linking circuit dynamics to behavior requires precise control of sensory stimuli and measurement of body movements. Head-fixation has been used for behavioral research, particularly in non-human primates, to facilitate precise stimulus control, behavioral monitoring and neural recording. However, choice-based, perceptual decision tasks by head-fixed mice have only recently been introduced. Training mice relies on motivating mice using water restriction. Here we describe procedures for head-fixation, water restriction and behavioral training for head-fixed mice, with a focus on active, whisker-based tactile behaviors. In these experiments mice had restricted access to water (typically 1 ml/day). After ten days of water restriction, body weight stabilized at approximately 80% of initial weight. At that point mice were trained to discriminate sensory stimuli using operant conditioning. Head-fixed mice reported stimuli by licking in go/no-go tasks and also using a forced choice paradigm using a dual lickport. In some cases mice learned to discriminate sensory stimuli in a few trials within the first behavioral session. Delay epochs lasting a second or more were used to separate sensation (e.g. tactile exploration) and action (i.e. licking). Mice performed a variety of perceptual decision tasks with high performance for hundreds of trials per behavioral session. Up to four months of continuous water restriction showed no adverse health effects. Behavioral performance correlated with the degree of water restriction, supporting the importance of controlling access to water. These behavioral paradigms can be combined with cellular resolution imaging, random access photostimulation, and whole cell recordings.
Mitochondrial antiviral signaling (MAVS) protein is required for innate immune responses against RNA viruses. In virus-infected cells MAVS forms prion-like aggregates to activate antiviral signaling cascades, but the underlying structural mechanism is unknown. Here we report cryo-electron microscopic structures of the helical filaments formed by both the N-terminal caspase activation and recruitment domain (CARD) of MAVS and a truncated MAVS lacking part of the proline-rich region and the C-terminal transmembrane domain. Both structures are left-handed three-stranded helical filaments, revealing specific interfaces between individual CARD subunits that are dictated by electrostatic interactions between neighboring strands and hydrophobic interactions within each strand. Point mutations at multiple locations of these two interfaces impaired filament formation and antiviral signaling. Super-resolution imaging of virus-infected cells revealed rod-shaped MAVS clusters on mitochondria. These results elucidate the structural mechanism of MAVS polymerization, and explain how an α-helical domain uses distinct chemical interactions to form self-perpetuating filaments. DOI: http://dx.doi.org/10.7554/eLife.01489.001.
The mechanisms that control the sizes of a body and its many parts remain among the great puzzles in developmental biology. Why do animals grow to a species-specific body size, and how is the relative growth of their body parts controlled to so they grow to the right size, and in the correct proportion with body size, giving an animal its species-characteristic shape? Control of size must involve mechanisms that somehow assess some aspect of size and are upstream of mechanisms that regulate growth. These mechanisms are now beginning to be understood in the insects, in particular in Manduca sexta and Drosophila melanogaster. The control of size requires control of the rate of growth and control of the cessation of growth. Growth is controlled by genetic and environmental factors. Insulin and ecdysone, their receptors, and intracellular signaling pathways are the principal genetic regulators of growth. The secretion of these growth hormones, in turn, is controlled by complex interactions of other endocrine and molecular mechanisms, by environmental factors such as nutrition, and by the physiological mechanisms that sense body size. Although the general mechanisms of growth regulation appear to be widely shared, the mechanisms that regulate final size can be quite diverse. WIREs Dev Biol 2014, 3:113–134. doi: 10.1002/wdev.124
In this paper, we provide a historical account of the contribution of a single line of research to our current understanding of the structure of cis-regulatory regions and the genetic basis for morphological evolution. We revisit the experiments that shed light on the evolution of larval cuticular patterns within the genus Drosophila and the evolution and structure of the shavenbaby gene. We describe the experiments that led to the discovery that multiple genetic changes in the cis-regulatory region of shavenbaby caused the loss of dorsal cuticular hairs (quaternary trichomes) in first instar larvae of Drosophila sechellia. We also discuss the experiments that showed that the convergent loss of quaternary trichomes in D. sechellia and Drosophila ezoana was generated by parallel genetic changes in orthologous enhancers of shavenbaby. We discuss the observation that multiple shavenbaby enhancers drive overlapping patterns of expression in the embryo and that these apparently redundant enhancers ensure robust shavenbaby expression and trichome morphogenesis under stressful conditions. All together, these data, collected over 13 years, provide a fundamental case study in the fields of gene regulation and morphological evolution, and highlight the importance of prolonged, detailed studies of single genes.
Neuronal computation involves the integration of synaptic inputs that are often distributed over expansive dendritic trees, suggesting the need for compensatory mechanisms that enable spatially disparate synapses to influence neuronal output. In hippocampal CA1 pyramidal neurons, such mechanisms have indeed been reported, which normalize either the ability of distributed synapses to drive action potential initiation in the axon or their ability to drive dendritic spiking locally. Here we report that these mechanisms can coexist, through an elegant combination of distance-dependent regulation of synapse number and synaptic expression of AMPA and NMDA receptors. Together, these complementary gradients allow individual dendrites in both the apical and basal dendritic trees of hippocampal neurons to operate as facile computational subunits capable of supporting both global integration in the soma/axon and local integration in the dendrite.
The hippocampal CA3 region is essential for pattern completion and generation of sharp-wave ripples. During these operations, coordinated activation of ensembles of CA3 pyramidal neurons produces spatiotemporally structured input patterns arriving onto dendrites of recurrently connected CA3 neurons. To understand how such input patterns are translated into specific output patterns, we characterized dendritic integration in CA3 pyramidal cells using two-photon imaging and glutamate uncaging. We found that thin dendrites of CA3 pyramidal neurons integrate synchronous synaptic input in a highly supralinear fashion. The amplification was primarily mediated by NMDA receptor activation and was present over a relatively broad range of spatiotemporal input patterns. The decay of voltage responses, temporal summation, and action potential output was regulated in a compartmentalized fashion mainly by a G-protein-activated inwardly rectifying K(+) current. Our results suggest that plastic dendritic integrative mechanisms may support ensemble behavior in pyramidal neurons of the hippocampal circuitry.
The gills of most teleost fishes are covered by plate-like structures, the secondary lamellae, that provide the bulk of the respiratory surface area. Water passing over the secondary lamellae exchanges gases with blood passing through the secondary lamellae, forming a system that has served as a classic model of counter-current exchange. In this study, a computational model of flow around the secondary lamellae is used to examine the hydrodynamic consequences of changes to the lamellar morphology. Consistent with previous studies, the interlamellar distance is found to strongly affect the hydrodynamic resistance of the gills. However, the presence of a small gap between the tips of the secondary lamellae is found to have a similarly strong effect on the hydrodynamic resistance and flow patterns within the gills. The results from this model have been generally formulated, allowing the calculation of the hydrodynamic resistance for measured morphometric parameters. These results provide a new basis for comparing theoretical predictions of the gill resistance with measured values, and provide a general model for examining the diversity gill morphologies observed in teleost fishes.
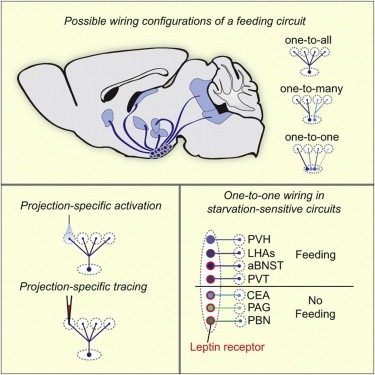
Neural circuits for essential natural behaviors are shaped by selective pressure to coordinate reliable execution of flexible goal-directed actions. However, the structural and functional organization of survival-oriented circuits is poorly understood due to exceptionally complex neuroanatomy. This is exemplified by AGRP neurons, which are a molecularly defined population that is sufficient to rapidly coordinate voracious food seeking and consumption behaviors. Here, we use cell-type-specific techniques for neural circuit manipulation and projection-specific anatomical analysis to examine the organization of this critical homeostatic circuit that regulates feeding. We show that AGRP neuronal circuits use a segregated, parallel, and redundant output configuration. AGRP neuron axon projections that target different brain regions originate from distinct subpopulations, several of which are sufficient to independently evoke feeding. The concerted anatomical and functional analysis of AGRP neuron projection populations reveals a constellation of core forebrain nodes, which are part of an extended circuit that mediates feeding behavior.
Mapping mammalian synaptic connectivity has long been an important goal of neuroscientists since it is considered crucial for explaining human perception and behavior. Yet, despite enormous efforts, the overwhelming complexity of the neural circuitry and the lack of appropriate techniques to unravel it have limited the success of efforts to map connectivity. However, recent technological advances designed to overcome the limitations of conventional methods for connectivity mapping may bring about a turning point. Here, we address the promises and pitfalls of these new mapping technologies.