node_title | node_title
Connectome Analysis Tools and Algorithms
node_body | node_body
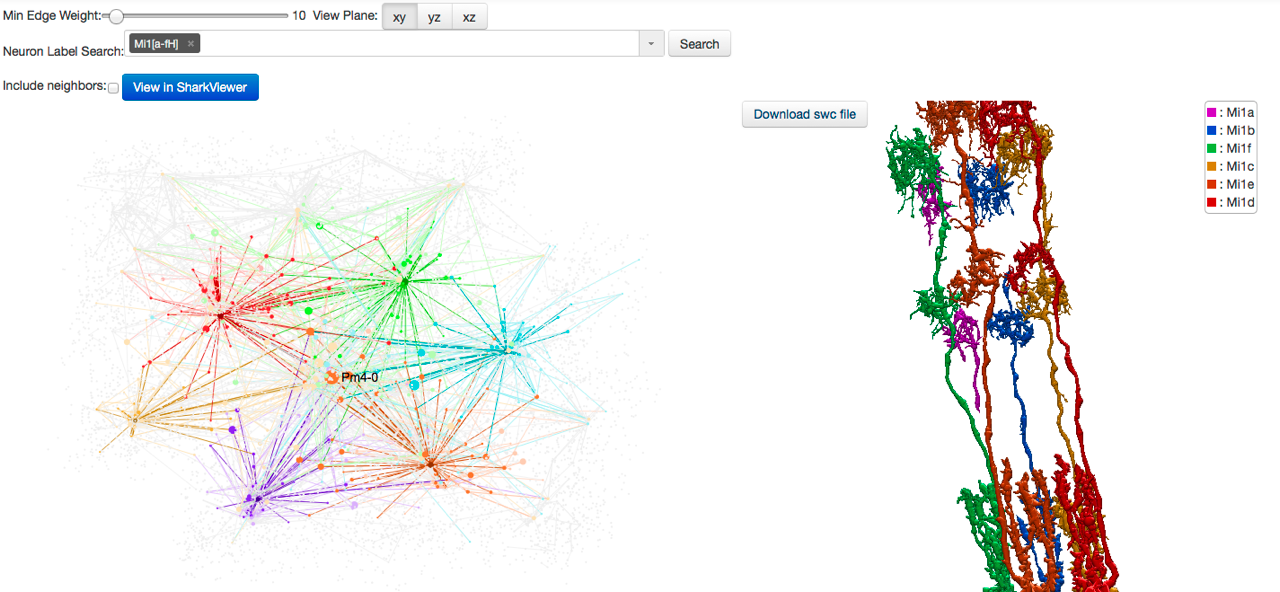 After deriving a connectome, the resulting data can be overwhelming for scientists. FlyEM introduces several tools to quickly analyze neuronal shapes, visualize connectivity, and show interesting patterns and trends. Many of these tools are web-based and operate interactively.
Highlights:
- Web tools for viewing neuron shapes and analyzing the connectome graph
- Neuron shape-matching and clustering algorithms
- NeuTu software: a cross-platform software tool for neuron reconstruction and visualization. The reconstruction function of NeuTu takes an image, which can be from dark/bright field light microscopy or a label field from EM segmentation, and outputs a neuron shape in the SWC format automatically or interactively. Its visualization function provides both 2D and 3D visualization of images and SWC files. NeuTu enables fast visualization of multiple neurons, which may contain hundreds of thousands of nodes, in the same scene. Its versatile color coding options allow the user to see clearly important features of neurons such as topological structures, branching directions and type identification. In addition to its general functions, NeuTu has some special functions assisting EM connectome reconstructions. Those functions include automatic neuron type identification, ROI creation and 3D neuron body splitting.