Filter
Associated Lab
- Aguilera Castrejon Lab (1) Apply Aguilera Castrejon Lab filter
- Ahrens Lab (53) Apply Ahrens Lab filter
- Aso Lab (40) Apply Aso Lab filter
- Baker Lab (19) Apply Baker Lab filter
- Betzig Lab (101) Apply Betzig Lab filter
- Beyene Lab (8) Apply Beyene Lab filter
- Bock Lab (14) Apply Bock Lab filter
- Branson Lab (50) Apply Branson Lab filter
- Card Lab (36) Apply Card Lab filter
- Cardona Lab (45) Apply Cardona Lab filter
- Chklovskii Lab (10) Apply Chklovskii Lab filter
- Clapham Lab (14) Apply Clapham Lab filter
- Cui Lab (19) Apply Cui Lab filter
- Darshan Lab (8) Apply Darshan Lab filter
- Dickson Lab (32) Apply Dickson Lab filter
- Druckmann Lab (21) Apply Druckmann Lab filter
- Dudman Lab (38) Apply Dudman Lab filter
- Eddy/Rivas Lab (30) Apply Eddy/Rivas Lab filter
- Egnor Lab (4) Apply Egnor Lab filter
- Espinosa Medina Lab (15) Apply Espinosa Medina Lab filter
- Feliciano Lab (7) Apply Feliciano Lab filter
- Fetter Lab (31) Apply Fetter Lab filter
- Fitzgerald Lab (16) Apply Fitzgerald Lab filter
- Freeman Lab (15) Apply Freeman Lab filter
- Funke Lab (38) Apply Funke Lab filter
- Gonen Lab (59) Apply Gonen Lab filter
- Grigorieff Lab (34) Apply Grigorieff Lab filter
- Harris Lab (53) Apply Harris Lab filter
- Heberlein Lab (13) Apply Heberlein Lab filter
- Hermundstad Lab (23) Apply Hermundstad Lab filter
- Hess Lab (74) Apply Hess Lab filter
- Ilanges Lab (2) Apply Ilanges Lab filter
- Jayaraman Lab (42) Apply Jayaraman Lab filter
- Ji Lab (33) Apply Ji Lab filter
- Johnson Lab (1) Apply Johnson Lab filter
- Karpova Lab (13) Apply Karpova Lab filter
- Keleman Lab (8) Apply Keleman Lab filter
- Keller Lab (61) Apply Keller Lab filter
- Koay Lab (2) Apply Koay Lab filter
- Lavis Lab (137) Apply Lavis Lab filter
- Lee (Albert) Lab (29) Apply Lee (Albert) Lab filter
- Leonardo Lab (19) Apply Leonardo Lab filter
- Li Lab (4) Apply Li Lab filter
- Lippincott-Schwartz Lab (97) Apply Lippincott-Schwartz Lab filter
- Liu (Yin) Lab (1) Apply Liu (Yin) Lab filter
- Liu (Zhe) Lab (58) Apply Liu (Zhe) Lab filter
- Looger Lab (137) Apply Looger Lab filter
- Magee Lab (31) Apply Magee Lab filter
- Menon Lab (12) Apply Menon Lab filter
- Murphy Lab (6) Apply Murphy Lab filter
- O'Shea Lab (6) Apply O'Shea Lab filter
- Otopalik Lab (1) Apply Otopalik Lab filter
- Pachitariu Lab (36) Apply Pachitariu Lab filter
- Pastalkova Lab (5) Apply Pastalkova Lab filter
- Pavlopoulos Lab (7) Apply Pavlopoulos Lab filter
- Pedram Lab (4) Apply Pedram Lab filter
- Podgorski Lab (16) Apply Podgorski Lab filter
- Reiser Lab (45) Apply Reiser Lab filter
- Riddiford Lab (20) Apply Riddiford Lab filter
- Romani Lab (31) Apply Romani Lab filter
- Rubin Lab (105) Apply Rubin Lab filter
- Saalfeld Lab (46) Apply Saalfeld Lab filter
- Satou Lab (1) Apply Satou Lab filter
- Scheffer Lab (36) Apply Scheffer Lab filter
- Schreiter Lab (50) Apply Schreiter Lab filter
- Sgro Lab (1) Apply Sgro Lab filter
- Shroff Lab (31) Apply Shroff Lab filter
- Simpson Lab (18) Apply Simpson Lab filter
- Singer Lab (37) Apply Singer Lab filter
- Spruston Lab (57) Apply Spruston Lab filter
- Stern Lab (73) Apply Stern Lab filter
- Sternson Lab (47) Apply Sternson Lab filter
- Stringer Lab (32) Apply Stringer Lab filter
- Svoboda Lab (131) Apply Svoboda Lab filter
- Tebo Lab (9) Apply Tebo Lab filter
- Tervo Lab (9) Apply Tervo Lab filter
- Tillberg Lab (18) Apply Tillberg Lab filter
- Tjian Lab (17) Apply Tjian Lab filter
- Truman Lab (58) Apply Truman Lab filter
- Turaga Lab (39) Apply Turaga Lab filter
- Turner Lab (27) Apply Turner Lab filter
- Vale Lab (7) Apply Vale Lab filter
- Voigts Lab (3) Apply Voigts Lab filter
- Wang (Meng) Lab (21) Apply Wang (Meng) Lab filter
- Wang (Shaohe) Lab (6) Apply Wang (Shaohe) Lab filter
- Wu Lab (8) Apply Wu Lab filter
- Zlatic Lab (26) Apply Zlatic Lab filter
- Zuker Lab (5) Apply Zuker Lab filter
Associated Project Team
- CellMap (12) Apply CellMap filter
- COSEM (3) Apply COSEM filter
- FIB-SEM Technology (3) Apply FIB-SEM Technology filter
- Fly Descending Interneuron (11) Apply Fly Descending Interneuron filter
- Fly Functional Connectome (14) Apply Fly Functional Connectome filter
- Fly Olympiad (5) Apply Fly Olympiad filter
- FlyEM (53) Apply FlyEM filter
- FlyLight (49) Apply FlyLight filter
- GENIE (46) Apply GENIE filter
- Integrative Imaging (4) Apply Integrative Imaging filter
- Larval Olympiad (2) Apply Larval Olympiad filter
- MouseLight (18) Apply MouseLight filter
- NeuroSeq (1) Apply NeuroSeq filter
- ThalamoSeq (1) Apply ThalamoSeq filter
- Tool Translation Team (T3) (26) Apply Tool Translation Team (T3) filter
- Transcription Imaging (45) Apply Transcription Imaging filter
Associated Support Team
- Project Pipeline Support (5) Apply Project Pipeline Support filter
- Anatomy and Histology (18) Apply Anatomy and Histology filter
- Cryo-Electron Microscopy (36) Apply Cryo-Electron Microscopy filter
- Electron Microscopy (16) Apply Electron Microscopy filter
- Gene Targeting and Transgenics (11) Apply Gene Targeting and Transgenics filter
- Integrative Imaging (17) Apply Integrative Imaging filter
- Invertebrate Shared Resource (40) Apply Invertebrate Shared Resource filter
- Janelia Experimental Technology (37) Apply Janelia Experimental Technology filter
- Management Team (1) Apply Management Team filter
- Molecular Genomics (15) Apply Molecular Genomics filter
- Primary & iPS Cell Culture (14) Apply Primary & iPS Cell Culture filter
- Project Technical Resources (50) Apply Project Technical Resources filter
- Quantitative Genomics (19) Apply Quantitative Genomics filter
- Scientific Computing Software (92) Apply Scientific Computing Software filter
- Scientific Computing Systems (7) Apply Scientific Computing Systems filter
- Viral Tools (14) Apply Viral Tools filter
- Vivarium (7) Apply Vivarium filter
Publication Date
- 2025 (126) Apply 2025 filter
- 2024 (215) Apply 2024 filter
- 2023 (159) Apply 2023 filter
- 2022 (167) Apply 2022 filter
- 2021 (175) Apply 2021 filter
- 2020 (177) Apply 2020 filter
- 2019 (177) Apply 2019 filter
- 2018 (206) Apply 2018 filter
- 2017 (186) Apply 2017 filter
- 2016 (191) Apply 2016 filter
- 2015 (195) Apply 2015 filter
- 2014 (190) Apply 2014 filter
- 2013 (136) Apply 2013 filter
- 2012 (112) Apply 2012 filter
- 2011 (98) Apply 2011 filter
- 2010 (61) Apply 2010 filter
- 2009 (56) Apply 2009 filter
- 2008 (40) Apply 2008 filter
- 2007 (21) Apply 2007 filter
- 2006 (3) Apply 2006 filter
2691 Janelia Publications
Showing 2331-2340 of 2691 resultsMany tools are available to analyse genomes but are often challenging to use in a cell type-specific context. We have developed a method similar to the isolation of nuclei tagged in a specific cell type (INTACT) technique [Deal,R.B. and Henikoff,S. (2010) A simple method for gene expression and chromatin profiling of individual cell types within a tissue. Dev. Cell, 18, 1030-1040; Steiner,F.A., Talbert,P.B., Kasinathan,S., Deal,R.B. and Henikoff,S. (2012) Cell-type-specific nuclei purification from whole animals for genome-wide expression and chromatin profiling. Genome Res., doi:10.1101/gr.131748.111], first developed in plants, for use in Drosophila neurons. We profile gene expression and histone modifications in Kenyon cells and octopaminergic neurons in the adult brain. In addition to recovering known gene expression differences, we also observe significant cell type-specific chromatin modifications. In particular, a small subset of differentially expressed genes exhibits a striking anti-correlation between repressive and activating histone modifications. These genes are enriched for transcription factors, recovering those known to regulate mushroom body identity and predicting analogous regulators of octopaminergic neurons. Our results suggest that applying INTACT to specific neuronal populations can illuminate the transcriptional regulatory networks that underlie neuronal cell identity.
Cortical-feedback projections to primary sensory areas terminate most heavily in layer 1 (L1) of the neocortex, where they make synapses with tuft dendrites of pyramidal neurons. L1 input is thought to provide ‘contextual’ information, but the signals transmitted by L1 feedback remain uncharacterized. In the rodent somatosensory system, the spatially diffuse feedback projection from vibrissal motor cortex (vM1) to vibrissal somatosensory cortex (vS1, also known as the barrel cortex) may allow whisker touch to be interpreted in the context of whisker position to compute object location. When mice palpate objects with their whiskers to localize object features, whisker touch excites vS1 and later vM1 in a somatotopic manner. Here we use axonal calcium imaging to track activity in vM1–>vS1 afferents in L1 of the barrel cortex while mice performed whisker-dependent object localization. Spatially intermingled individual axons represent whisker movements, touch and other behavioural features. In a subpopulation of axons, activity depends on object location and persists for seconds after touch. Neurons in the barrel cortex thus have information to integrate movements and touches of multiple whiskers over time, key components of object identification and navigation by active touch.
BACKGROUND: In holometabolous insects such as Drosophila melanogaster, neuroblasts produce an initial population of diverse neurons during embryogenesis and a much larger set of adult-specific neurons during larval life. In the ventral CNS, many of these secondary neuronal lineages differ significantly from one body segment to another, suggesting a role for anteroposterior patterning genes. RESULTS: Here we systematically characterize the expression pattern and function of the Hox gene Ultrabithorax (Ubx) in all 25 postembryonic lineages. We find that Ubx is expressed in a segment-, lineage-, and hemilineage-specific manner in the thoracic and anterior abdominal segments. When Ubx is removed from neuroblasts via mitotic recombination, neurons in these segments exhibit the morphologies and survival patterns of their anterior thoracic counterparts. Conversely, when Ubx is ectopically expressed in anterior thoracic segments, neurons exhibit complementary posterior transformation phenotypes. CONCLUSION: Our findings demonstrate that Ubx plays a critical role in conferring segment-appropriate morphology and survival on individual neurons in the adult-specific ventral CNS. Moreover, while always conferring spatial identity in some sense, Ubx has been co-opted during evolution for distinct and even opposite functions in different neuronal hemilineages.
Acetyl esterases from carbohydrate esterase family 7 exhibit unusual substrate specificity. These proteins catalyze the cleavage of disparate acetate esters with high efficiency, but are unreactive to larger acyl groups. The structural basis for this distinct selectivity profile is unknown. Here, we investigate a thermostable acetyl esterase (TM0077) from Thermotoga maritima using evolutionary relationships, structural information, fluorescent kinetic measurements, and site directed mutagenesis. We measured the kinetic and structural determinants for this specificity using a diverse series of small molecule enzyme substrates, including novel fluorogenic esters. These experiments identified two hydrophobic plasticity residues (Pro228, and Ile276) surrounding the nucleophilic serine that impart this specificity of TM0077 for small, straight-chain esters. Substitution of these residues with alanine imparts broader specificity to TM0077 for the hydrolysis of longer and bulkier esters. Our results suggest the specificity of acetyl esterases have been finely tuned by evolution to catalyze the removal of acetate groups from diverse substrates, but can be modified by focused amino acid substitutions to yield enzymes capable of cleaving larger ester functionalities.
Animals approach stimuli that predict a pleasant outcome. After the paired presentation of an odour and a reward, Drosophila melanogaster can develop a conditioned approach towards that odour. Despite recent advances in understanding the neural circuits for associative memory and appetitive motivation, the cellular mechanisms for reward processing in the fly brain are unknown. Here we show that a group of dopamine neurons in the protocerebral anterior medial (PAM) cluster signals sugar reward by transient activation and inactivation of target neurons in intact behaving flies. These dopamine neurons are selectively required for the reinforcing property of, but not a reflexive response to, the sugar stimulus. In vivo calcium imaging revealed that these neurons are activated by sugar ingestion and the activation is increased on starvation. The output sites of the PAM neurons are mainly localized to the medial lobes of the mushroom bodies (MBs), where appetitive olfactory associative memory is formed. We therefore propose that the PAM cluster neurons endow a positive predictive value to the odour in the MBs. Dopamine in insects is known to mediate aversive reinforcement signals. Our results highlight the cellular specificity underlying the various roles of dopamine and the importance of spatially segregated local circuits within the MBs.
The origin of the spatial receptive fields of hippocampal place cells has not been established. A hippocampal CA1 pyramidal cell receives thousands of synaptic inputs, mostly from other spatially tuned neurons; however, how the postsynaptic neuron’s cellular properties determine the response to these inputs during behavior is unknown. We discovered that, contrary to expectations from basic models of place cells and neuronal integration, a small, spatially uniform depolarization of the spatially untuned somatic membrane potential of a silent cell leads to the sudden and reversible emergence of a spatially tuned subthreshold response and place-field spiking. Such gating of inputs by postsynaptic neuronal excitability reveals a cellular mechanism for receptive field origin and may be critical for the formation of hippocampal memory representations.
Chromosomes must be accurately partitioned to daughter cells to prevent aneuploidy, a hallmark of many tumors and birth defects. Kinetochores are the macromolecular machines that segregate chromosomes by maintaining load-bearing attachments to the dynamic tips of microtubules. Here, we present the structure of isolated budding-yeast kinetochore particles, as visualized by EM and electron tomography of negatively stained preparations. The kinetochore appears as an 126-nm particle containing a large central hub surrounded by multiple outer globular domains. In the presence of microtubules, some particles also have a ring that encircles the microtubule. Our data, showing that kinetochores bind to microtubules via multivalent attachments, lay the foundation to uncover the key mechanical and regulatory mechanisms by which kinetochores control chromosome segregation and cell division.
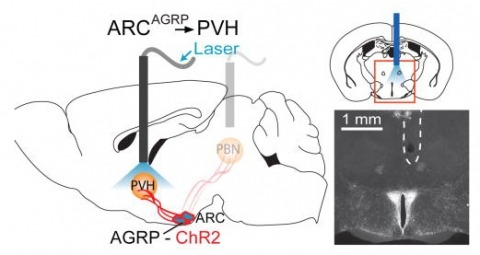
Hunger is a complex behavioural state that elicits intense food seeking and consumption. These behaviours are rapidly recapitulated by activation of starvation-sensitive AGRP neurons, which present an entry point for reverse-engineering neural circuits for hunger. Here we mapped synaptic interactions of AGRP neurons with multiple cell populations in mice and probed the contribution of these distinct circuits to feeding behaviour using optogenetic and pharmacogenetic techniques. An inhibitory circuit with paraventricular hypothalamus (PVH) neurons substantially accounted for acute AGRP neuron-evoked eating, whereas two other prominent circuits were insufficient. Within the PVH, we found that AGRP neurons target and inhibit oxytocin neurons, a small population that is selectively lost in Prader-Willi syndrome, a condition involving insatiable hunger. By developing strategies for evaluating molecularly defined circuits, we show that AGRP neuron suppression of oxytocin neurons is critical for evoked feeding. These experiments reveal a new neural circuit that regulates hunger state and pathways associated with overeating disorders.
The CA3 and CA1 pyramidal neurons are the major principal cell types of the hippocampus proper. The strongly recurrent collateral system of CA3 cells and the largely parallel-organized CA1 neurons suggest that these regions perform distinct computations. However, a comprehensive comparison between CA1 and CA3 pyramidal cells in terms of firing properties, network dynamics, and behavioral correlations is sparse in the intact animal. We performed large-scale recordings in the dorsal hippocampus of rats to quantify the similarities and differences between CA1 (n > 3,600) and CA3 (n > 2,200) pyramidal cells during sleep and exploration in multiple environments. CA1 and CA3 neurons differed significantly in firing rates, spike burst propensity, spike entrainment by the theta rhythm, and other aspects of spiking dynamics in a brain state-dependent manner. A smaller proportion of CA3 than CA1 cells displayed prominent place fields, but place fields of CA3 neurons were more compact, more stable, and carried more spatial information per spike than those of CA1 pyramidal cells. Several other features of the two cell types were specific to the testing environment. CA3 neurons showed less pronounced phase precession and a weaker position versus spike-phase relationship than CA1 cells. Our findings suggest that these distinct activity dynamics of CA1 and CA3 pyramidal cells support their distinct computational roles.
Fluorescence imaging has revolutionized biomedical research over the past three decades. Its high molecular specificity and unrivalled single-molecule-level sensitivity have enabled breakthroughs in a number of research fields. For in vivo applications its major limitation is its superficial imaging depth, a result of random scattering in biological tissues causing exponential attenuation of the ballistic component of a light wave. Here, we present fluorescence imaging beyond the ballistic regime by combining single-cycle pulsed ultrasound modulation and digital optical phase conjugation. We demonstrate a near-isotropic three-dimensional localized sound–light interaction zone. With the exceptionally high optical gain provided by the digital optical phase conjugation system, we can deliver sufficient optical power to a focus inside highly scattering media for not only fluorescence imaging but also a variety of linear and nonlinear spectroscopy measurements. This technology paves the way for many important applications in both fundamental biology research and clinical studies.