Filter
Associated Lab
- Aguilera Castrejon Lab (19) Apply Aguilera Castrejon Lab filter
- Ahrens Lab (73) Apply Ahrens Lab filter
- Aso Lab (42) Apply Aso Lab filter
- Baker Lab (38) Apply Baker Lab filter
- Betzig Lab (116) Apply Betzig Lab filter
- Beyene Lab (15) Apply Beyene Lab filter
- Bock Lab (17) Apply Bock Lab filter
- Branson Lab (55) Apply Branson Lab filter
- Card Lab (43) Apply Card Lab filter
- Cardona Lab (64) Apply Cardona Lab filter
- Chklovskii Lab (13) Apply Chklovskii Lab filter
- Clapham Lab (16) Apply Clapham Lab filter
- Cui Lab (19) Apply Cui Lab filter
- Darshan Lab (12) Apply Darshan Lab filter
- Dennis Lab (3) Apply Dennis Lab filter
- Dickson Lab (46) Apply Dickson Lab filter
- Druckmann Lab (25) Apply Druckmann Lab filter
- Dudman Lab (56) Apply Dudman Lab filter
- Eddy/Rivas Lab (30) Apply Eddy/Rivas Lab filter
- Egnor Lab (11) Apply Egnor Lab filter
- Espinosa Medina Lab (24) Apply Espinosa Medina Lab filter
- Feliciano Lab (14) Apply Feliciano Lab filter
- Fetter Lab (41) Apply Fetter Lab filter
- FIB-SEM Technology (1) Apply FIB-SEM Technology filter
- Fitzgerald Lab (30) Apply Fitzgerald Lab filter
- Freeman Lab (15) Apply Freeman Lab filter
- Funke Lab (46) Apply Funke Lab filter
- Gonen Lab (91) Apply Gonen Lab filter
- Grigorieff Lab (62) Apply Grigorieff Lab filter
- Harris Lab (65) Apply Harris Lab filter
- Heberlein Lab (94) Apply Heberlein Lab filter
- Hermundstad Lab (30) Apply Hermundstad Lab filter
- Hess Lab (80) Apply Hess Lab filter
- Ilanges Lab (4) Apply Ilanges Lab filter
- Jayaraman Lab (48) Apply Jayaraman Lab filter
- Ji Lab (33) Apply Ji Lab filter
- Johnson Lab (7) Apply Johnson Lab filter
- Kainmueller Lab (19) Apply Kainmueller Lab filter
- Karpova Lab (15) Apply Karpova Lab filter
- Keleman Lab (13) Apply Keleman Lab filter
- Keller Lab (76) Apply Keller Lab filter
- Koay Lab (20) Apply Koay Lab filter
- Lavis Lab (159) Apply Lavis Lab filter
- Lee (Albert) Lab (34) Apply Lee (Albert) Lab filter
- Leonardo Lab (23) Apply Leonardo Lab filter
- Li Lab (32) Apply Li Lab filter
- Lippincott-Schwartz Lab (180) Apply Lippincott-Schwartz Lab filter
- Liu (Yin) Lab (8) Apply Liu (Yin) Lab filter
- Liu (Zhe) Lab (65) Apply Liu (Zhe) Lab filter
- Looger Lab (138) Apply Looger Lab filter
- Magee Lab (49) Apply Magee Lab filter
- Menon Lab (18) Apply Menon Lab filter
- Murphy Lab (13) Apply Murphy Lab filter
- O'Shea Lab (8) Apply O'Shea Lab filter
- Otopalik Lab (13) Apply Otopalik Lab filter
- Pachitariu Lab (54) Apply Pachitariu Lab filter
- Pastalkova Lab (19) Apply Pastalkova Lab filter
- Pavlopoulos Lab (19) Apply Pavlopoulos Lab filter
- Pedram Lab (15) Apply Pedram Lab filter
- Podgorski Lab (16) Apply Podgorski Lab filter
- Reiser Lab (55) Apply Reiser Lab filter
- Riddiford Lab (44) Apply Riddiford Lab filter
- Romani Lab (51) Apply Romani Lab filter
- Rubin Lab (149) Apply Rubin Lab filter
- Saalfeld Lab (64) Apply Saalfeld Lab filter
- Satou Lab (18) Apply Satou Lab filter
- Scheffer Lab (38) Apply Scheffer Lab filter
- Schreiter Lab (70) Apply Schreiter Lab filter
- Schulze Lab (1) Apply Schulze Lab filter
- Sgro Lab (23) Apply Sgro Lab filter
- Shroff Lab (31) Apply Shroff Lab filter
- Simpson Lab (23) Apply Simpson Lab filter
- Singer Lab (80) Apply Singer Lab filter
- Spruston Lab (98) Apply Spruston Lab filter
- Stern Lab (160) Apply Stern Lab filter
- Sternson Lab (54) Apply Sternson Lab filter
- Stringer Lab (43) Apply Stringer Lab filter
- Svoboda Lab (136) Apply Svoboda Lab filter
- Tebo Lab (36) Apply Tebo Lab filter
- Tervo Lab (10) Apply Tervo Lab filter
- Tillberg Lab (22) Apply Tillberg Lab filter
- Tjian Lab (64) Apply Tjian Lab filter
- Truman Lab (88) Apply Truman Lab filter
- Turaga Lab (53) Apply Turaga Lab filter
- Turner Lab (38) Apply Turner Lab filter
- Vale Lab (8) Apply Vale Lab filter
- Voigts Lab (5) Apply Voigts Lab filter
- Wang (Meng) Lab (29) Apply Wang (Meng) Lab filter
- Wang (Shaohe) Lab (25) Apply Wang (Shaohe) Lab filter
- Wong-Campos Lab (1) Apply Wong-Campos Lab filter
- Wu Lab (9) Apply Wu Lab filter
- Zlatic Lab (28) Apply Zlatic Lab filter
- Zuker Lab (25) Apply Zuker Lab filter
Associated Project Team
- CellMap (13) Apply CellMap filter
- COSEM (3) Apply COSEM filter
- FIB-SEM Technology (5) Apply FIB-SEM Technology filter
- Fly Descending Interneuron (12) Apply Fly Descending Interneuron filter
- Fly Functional Connectome (14) Apply Fly Functional Connectome filter
- Fly Olympiad (5) Apply Fly Olympiad filter
- FlyEM (56) Apply FlyEM filter
- FlyLight (50) Apply FlyLight filter
- GENIE (47) Apply GENIE filter
- Integrative Imaging (10) Apply Integrative Imaging filter
- Larval Olympiad (2) Apply Larval Olympiad filter
- MouseLight (18) Apply MouseLight filter
- NeuroSeq (1) Apply NeuroSeq filter
- ThalamoSeq (1) Apply ThalamoSeq filter
- Tool Translation Team (T3) (29) Apply Tool Translation Team (T3) filter
- Transcription Imaging (49) Apply Transcription Imaging filter
Publication Date
- 2026 (80) Apply 2026 filter
- 2025 (222) Apply 2025 filter
- 2024 (210) Apply 2024 filter
- 2023 (158) Apply 2023 filter
- 2022 (192) Apply 2022 filter
- 2021 (194) Apply 2021 filter
- 2020 (196) Apply 2020 filter
- 2019 (202) Apply 2019 filter
- 2018 (232) Apply 2018 filter
- 2017 (217) Apply 2017 filter
- 2016 (209) Apply 2016 filter
- 2015 (252) Apply 2015 filter
- 2014 (236) Apply 2014 filter
- 2013 (194) Apply 2013 filter
- 2012 (190) Apply 2012 filter
- 2011 (190) Apply 2011 filter
- 2010 (161) Apply 2010 filter
- 2009 (158) Apply 2009 filter
- 2008 (140) Apply 2008 filter
- 2007 (106) Apply 2007 filter
- 2006 (92) Apply 2006 filter
- 2005 (67) Apply 2005 filter
- 2004 (57) Apply 2004 filter
- 2003 (58) Apply 2003 filter
- 2002 (39) Apply 2002 filter
- 2001 (28) Apply 2001 filter
- 2000 (29) Apply 2000 filter
- 1999 (14) Apply 1999 filter
- 1998 (18) Apply 1998 filter
- 1997 (16) Apply 1997 filter
- 1996 (10) Apply 1996 filter
- 1995 (18) Apply 1995 filter
- 1994 (12) Apply 1994 filter
- 1993 (10) Apply 1993 filter
- 1992 (6) Apply 1992 filter
- 1991 (11) Apply 1991 filter
- 1990 (11) Apply 1990 filter
- 1989 (6) Apply 1989 filter
- 1988 (1) Apply 1988 filter
- 1987 (7) Apply 1987 filter
- 1986 (4) Apply 1986 filter
- 1985 (5) Apply 1985 filter
- 1984 (2) Apply 1984 filter
- 1983 (2) Apply 1983 filter
- 1982 (3) Apply 1982 filter
- 1981 (3) Apply 1981 filter
- 1980 (1) Apply 1980 filter
- 1979 (1) Apply 1979 filter
- 1976 (2) Apply 1976 filter
- 1973 (1) Apply 1973 filter
- 1970 (1) Apply 1970 filter
- 1967 (1) Apply 1967 filter
Type of Publication
4275 Publications
Showing 841-850 of 4275 results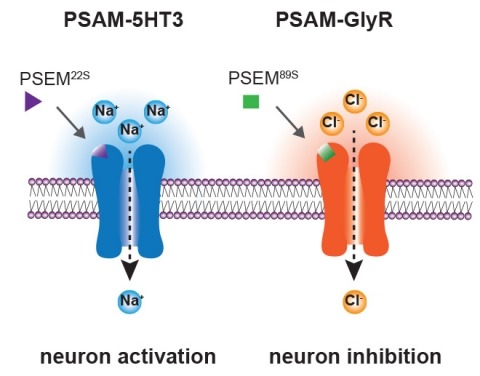
Ionic flux mediates essential physiological and behavioral functions in defined cell populations. Cell type-specific activators of diverse ionic conductances are needed for probing these effects. We combined chemistry and protein engineering to enable the systematic creation of a toolbox of ligand-gated ion channels (LGICs) with orthogonal pharmacologic selectivity and divergent functional properties. The LGICs and their small-molecule effectors were able to activate a range of ionic conductances in genetically specified cell types. LGICs constructed for neuronal perturbation could be used to selectively manipulate neuron activity in mammalian brains in vivo. The diversity of ion channel tools accessible from this approach will be useful for examining the relationship between neuronal activity and animal behavior, as well as for cell biological and physiological applications requiring chemical control of ion conductance.
Microbiota-derived metabolites have emerged as key regulators of longevity. The metabolic activity of the gut microbiota, influenced by dietary components and ingested chemical compounds, profoundly impacts host fitness. While the benefits of dietary prebiotics are well-known, chemically targeting the gut microbiota to enhance host fitness remains largely unexplored. Here, we report a novel chemical approach to induce a pro-longevity bacterial metabolite in the host gut. We discovered that specific Escherichia coli strains overproduce colanic acids (CAs) when exposed to a low dose of cephaloridine, leading to an increased lifespan in host Caenorhabditis elegans. In the mouse gut, oral administration of low-dose cephaloridine induces the transcription of the capsular biosynthesis operon responsible for CA biosynthesis in commensal E. coli, which overcomes the inhibition of CA biosynthesis above 30 degrees C and enables its induction directly from the microbiota. Importantly, low-dose cephaloridine induces CA independently of its antibiotic properties through a previously unknown mechanism mediated by the membrane-bound histidine kinase ZraS. Our work lays the foundation for microbiota-based therapeutics through the chemical modulation of bacterial metabolism and reveals the promising potential of bacteria-targeting drugs in promoting host longevity.
Microbiota-derived metabolites have emerged as key regulators of longevity. The metabolic activity of the gut microbiota, influenced by dietary components and ingested chemical compounds, profoundly impacts host fitness. While the benefits of dietary prebiotics are well-known, chemically targeting the gut microbiota to enhance host fitness remains largely unexplored. Here, we report a novel chemical approach to induce a pro-longevity bacterial metabolite in the host gut. We discovered that wild-type Escherichia coli strains overproduce colanic acids (CAs) when exposed to a low dose of cephaloridine, leading to an increased life span in the host organism Caenorhabditis elegans. In the mouse gut, oral administration of low-dose cephaloridine induced transcription of the capsular polysaccharide synthesis (cps) operon responsible for CA biosynthesis in commensal E. coli at 37 °C, and attenuated age-related metabolic changes. We also found that low-dose cephaloridine overcomes the temperature-dependent inhibition of CA biosynthesis and promotes its induction through a mechanism mediated by the membrane-bound histidine kinase ZraS, independently of cephaloridine's known antibiotic properties. Our work lays a foundation for microbiota-based therapeutics through chemical modulation of bacterial metabolism and highlights the promising potential of leveraging bacteria-targeting drugs in promoting host longevity.
Intrinsically disordered protein regions (IDRs) are peptide segments that fail to form stable 3-dimensional structures in the absence of partner proteins. They are abundant in eukaryotic proteomes and are often associated with human diseases, but their biological functions have been elusive to study. Here we report the identification of a tin(IV) oxochloride-derived cluster that binds an evolutionarily conserved IDR within the metazoan TFIID transcription complex. Binding arrests an isomerization of promoter-bound TFIID that is required for the engagement of Pol II during the first (de novo) round of transcription initiation. However, the specific chemical probe does not affect reinitiation, which requires the re-entry of Pol II, thus, mechanistically distinguishing these two modes of transcription initiation. This work also suggests a new avenue for targeting the elusive IDRs by harnessing certain features of metal-based complexes for mechanistic studies, and for the development of novel pharmaceutical interventions.
We report the rational engineering of a remarkably stable yellow fluorescent protein (YFP), 'hyperfolder YFP' (hfYFP), that withstands chaotropic conditions that denature most biological structures within seconds, including superfolder green fluorescent protein (GFP). hfYFP contains no cysteines, is chloride insensitive and tolerates aldehyde and osmium tetroxide fixation better than common fluorescent proteins, enabling its use in expansion and electron microscopies. We solved crystal structures of hfYFP (to 1.7-Å resolution), a monomeric variant, monomeric hyperfolder YFP (1.6 Å) and an mGreenLantern mutant (1.2 Å), and then rationally engineered highly stable 405-nm-excitable GFPs, large Stokes shift (LSS) monomeric GFP (LSSmGFP) and LSSA12 from these structures. Lastly, we directly exploited the chemical stability of hfYFP and LSSmGFP by devising a fluorescence-assisted protein purification strategy enabling all steps of denaturing affinity chromatography to be visualized using ultraviolet or blue light. hfYFP and LSSmGFP represent a new generation of robustly stable fluorescent proteins developed for advanced biotechnological applications.
Chemistry, once king of fluorescence microscopy, was usurped by the field of fluorescent proteins. The increased demands of modern microscopy techniques on the “photon budget” requires better and brighter fluorophores. Here, we review the recent advances in biochemistry, protein engineering, and organic synthesis that have allowed a triumphant return of chemical dyes to modern biological imaging.
The development of single-molecule localization microscopy (SMLM) has sparked a revolution in biological imaging, allowing 'super-resolution' fluorescence microscopy below the diffraction limit of light. The last decade has seen an explosion in not only optical hardware for SMLM but also the development or repurposing of fluorescent proteins and small-molecule fluorescent probes for this technique. In this review, written by chemists for chemists, we detail the history of single-molecule localization microscopy and collate the collection of probes with demonstrated utility in SMLM. We hope it will serve as a primer for probe choice in localization microscopy as well as an inspiration for the development of new fluorophores that enable imaging of biological samples with exquisite detail.
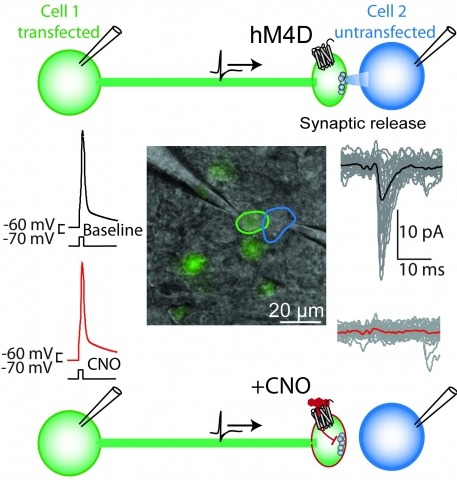
Brain function is mediated by neural circuit connectivity, and elucidating the role of connections is aided by techniques to block their output. We developed cell-type-selective, reversible synaptic inhibition tools for mammalian neural circuits by leveraging G protein signaling pathways to suppress synaptic vesicle release. Here, we find that the pharmacologically selective designer Gi-protein-coupled receptor hM4D is a presynaptic silencer in the presence of its cognate ligand clozapine-N-oxide (CNO). Activation of hM4D signaling sharply reduced synaptic release probability and synaptic current amplitude. To demonstrate the utility of this tool for neural circuit perturbations, we developed an axon-selective hM4D-neurexin variant and used spatially targeted intracranial CNO injections to localize circuit connections from the hypothalamus to the midbrain responsible for feeding behavior. This synaptic silencing approach is broadly applicable for cell-type-specific and axon projection-selective functional analysis of diverse neural circuits.
Chemogenetic technologies enable selective pharmacological control of specific cell populations. An increasing number of approaches have been developed that modulate different signaling pathways. Selective pharmacological control over G protein-coupled receptor signaling, ion channel conductances, protein association, protein stability, and small molecule targeting allows modulation of cellular processes in distinct cell types. Here, we review these chemogenetic technologies and instances of their applications in complex tissues in vivo and ex vivo.
Elucidating the roles of neuronal cell types for physiology and behavior is essential for understanding brain functions. Perturbation of neuron electrical activity can be used to probe the causal relationship between neuronal cell types and behavior. New genetically encoded neuron perturbation tools have been developed for remotely controlling neuron function using small molecules that activate engineered receptors that can be targeted to cell types using genetic methods. Here we describe recent progress for approaches using genetically engineered receptors that selectively interact with small molecules. Called "chemogenetics," receptors with diverse cellular functions have been developed that facilitate the selective pharmacological control over a diverse range of cell-signaling processes, including electrical activity, for molecularly defined cell types. These tools have revealed remarkably specific behavioral physiological influences for molecularly defined cell types that are often intermingled with populations having different or even opposite functions.