Filter
Associated Lab
- Aguilera Castrejon Lab (4) Apply Aguilera Castrejon Lab filter
- Ahrens Lab (64) Apply Ahrens Lab filter
- Aso Lab (42) Apply Aso Lab filter
- Baker Lab (19) Apply Baker Lab filter
- Betzig Lab (104) Apply Betzig Lab filter
- Beyene Lab (10) Apply Beyene Lab filter
- Bock Lab (14) Apply Bock Lab filter
- Branson Lab (53) Apply Branson Lab filter
- Card Lab (37) Apply Card Lab filter
- Cardona Lab (45) Apply Cardona Lab filter
- Chklovskii Lab (10) Apply Chklovskii Lab filter
- Clapham Lab (15) Apply Clapham Lab filter
- Cui Lab (19) Apply Cui Lab filter
- Darshan Lab (8) Apply Darshan Lab filter
- Dennis Lab (2) Apply Dennis Lab filter
- Dickson Lab (32) Apply Dickson Lab filter
- Druckmann Lab (21) Apply Druckmann Lab filter
- Dudman Lab (46) Apply Dudman Lab filter
- Eddy/Rivas Lab (30) Apply Eddy/Rivas Lab filter
- Egnor Lab (4) Apply Egnor Lab filter
- Espinosa Medina Lab (21) Apply Espinosa Medina Lab filter
- Feliciano Lab (16) Apply Feliciano Lab filter
- Fetter Lab (31) Apply Fetter Lab filter
- FIB-SEM Technology (1) Apply FIB-SEM Technology filter
- Fitzgerald Lab (17) Apply Fitzgerald Lab filter
- Freeman Lab (15) Apply Freeman Lab filter
- Funke Lab (46) Apply Funke Lab filter
- Gonen Lab (59) Apply Gonen Lab filter
- Grigorieff Lab (34) Apply Grigorieff Lab filter
- Harris Lab (55) Apply Harris Lab filter
- Heberlein Lab (13) Apply Heberlein Lab filter
- Hermundstad Lab (28) Apply Hermundstad Lab filter
- Hess Lab (77) Apply Hess Lab filter
- Ilanges Lab (4) Apply Ilanges Lab filter
- Jayaraman Lab (45) Apply Jayaraman Lab filter
- Ji Lab (33) Apply Ji Lab filter
- Johnson Lab (2) Apply Johnson Lab filter
- Karpova Lab (14) Apply Karpova Lab filter
- Keleman Lab (8) Apply Keleman Lab filter
- Keller Lab (62) Apply Keller Lab filter
- Koay Lab (4) Apply Koay Lab filter
- Lavis Lab (150) Apply Lavis Lab filter
- Lee (Albert) Lab (29) Apply Lee (Albert) Lab filter
- Leonardo Lab (19) Apply Leonardo Lab filter
- Li Lab (8) Apply Li Lab filter
- Lippincott-Schwartz Lab (110) Apply Lippincott-Schwartz Lab filter
- Liu (Yin) Lab (4) Apply Liu (Yin) Lab filter
- Liu (Zhe) Lab (60) Apply Liu (Zhe) Lab filter
- Looger Lab (137) Apply Looger Lab filter
- Magee Lab (31) Apply Magee Lab filter
- Menon Lab (12) Apply Menon Lab filter
- Murphy Lab (6) Apply Murphy Lab filter
- O'Shea Lab (7) Apply O'Shea Lab filter
- Otopalik Lab (1) Apply Otopalik Lab filter
- Pachitariu Lab (44) Apply Pachitariu Lab filter
- Pastalkova Lab (6) Apply Pastalkova Lab filter
- Pavlopoulos Lab (7) Apply Pavlopoulos Lab filter
- Pedram Lab (4) Apply Pedram Lab filter
- Podgorski Lab (16) Apply Podgorski Lab filter
- Reiser Lab (49) Apply Reiser Lab filter
- Riddiford Lab (20) Apply Riddiford Lab filter
- Romani Lab (40) Apply Romani Lab filter
- Rubin Lab (111) Apply Rubin Lab filter
- Saalfeld Lab (49) Apply Saalfeld Lab filter
- Satou Lab (3) Apply Satou Lab filter
- Scheffer Lab (38) Apply Scheffer Lab filter
- Schreiter Lab (55) Apply Schreiter Lab filter
- Schulze Lab (1) Apply Schulze Lab filter
- Sgro Lab (3) Apply Sgro Lab filter
- Shroff Lab (35) Apply Shroff Lab filter
- Simpson Lab (18) Apply Simpson Lab filter
- Singer Lab (37) Apply Singer Lab filter
- Spruston Lab (62) Apply Spruston Lab filter
- Stern Lab (77) Apply Stern Lab filter
- Sternson Lab (47) Apply Sternson Lab filter
- Stringer Lab (41) Apply Stringer Lab filter
- Svoboda Lab (132) Apply Svoboda Lab filter
- Tebo Lab (12) Apply Tebo Lab filter
- Tervo Lab (10) Apply Tervo Lab filter
- Tillberg Lab (19) Apply Tillberg Lab filter
- Tjian Lab (17) Apply Tjian Lab filter
- Truman Lab (58) Apply Truman Lab filter
- Turaga Lab (41) Apply Turaga Lab filter
- Turner Lab (27) Apply Turner Lab filter
- Vale Lab (8) Apply Vale Lab filter
- Voigts Lab (5) Apply Voigts Lab filter
- Wang (Meng) Lab (31) Apply Wang (Meng) Lab filter
- Wang (Shaohe) Lab (6) Apply Wang (Shaohe) Lab filter
- Wong-Campos Lab (1) Apply Wong-Campos Lab filter
- Wu Lab (8) Apply Wu Lab filter
- Zlatic Lab (26) Apply Zlatic Lab filter
- Zuker Lab (5) Apply Zuker Lab filter
Associated Project Team
- CellMap (13) Apply CellMap filter
- COSEM (3) Apply COSEM filter
- FIB-SEM Technology (5) Apply FIB-SEM Technology filter
- Fly Descending Interneuron (12) Apply Fly Descending Interneuron filter
- Fly Functional Connectome (14) Apply Fly Functional Connectome filter
- Fly Olympiad (5) Apply Fly Olympiad filter
- FlyEM (56) Apply FlyEM filter
- FlyLight (50) Apply FlyLight filter
- GENIE (47) Apply GENIE filter
- Integrative Imaging (11) Apply Integrative Imaging filter
- Larval Olympiad (2) Apply Larval Olympiad filter
- MouseLight (18) Apply MouseLight filter
- NeuroSeq (1) Apply NeuroSeq filter
- ThalamoSeq (1) Apply ThalamoSeq filter
- Tool Translation Team (T3) (29) Apply Tool Translation Team (T3) filter
- Transcription Imaging (45) Apply Transcription Imaging filter
Associated Support Team
- Project Pipeline Support (5) Apply Project Pipeline Support filter
- Anatomy and Histology (18) Apply Anatomy and Histology filter
- Cryo-Electron Microscopy (49) Apply Cryo-Electron Microscopy filter
- Electron Microscopy (18) Apply Electron Microscopy filter
- Gene Targeting and Transgenics (11) Apply Gene Targeting and Transgenics filter
- High Performance Computing (7) Apply High Performance Computing filter
- Integrative Imaging (25) Apply Integrative Imaging filter
- Invertebrate Shared Resource (40) Apply Invertebrate Shared Resource filter
- Janelia Experimental Technology (40) Apply Janelia Experimental Technology filter
- Management Team (1) Apply Management Team filter
- Mass Spectrometry (1) Apply Mass Spectrometry filter
- Molecular Genomics (15) Apply Molecular Genomics filter
- Project Technical Resources (54) Apply Project Technical Resources filter
- Quantitative Genomics (20) Apply Quantitative Genomics filter
- Scientific Computing (106) Apply Scientific Computing filter
- Stem Cell & Primary Culture (14) Apply Stem Cell & Primary Culture filter
- Viral Tools (14) Apply Viral Tools filter
- Vivarium (7) Apply Vivarium filter
Publication Date
- 2026 (118) Apply 2026 filter
- 2025 (223) Apply 2025 filter
- 2024 (208) Apply 2024 filter
- 2023 (157) Apply 2023 filter
- 2022 (166) Apply 2022 filter
- 2021 (175) Apply 2021 filter
- 2020 (177) Apply 2020 filter
- 2019 (177) Apply 2019 filter
- 2018 (206) Apply 2018 filter
- 2017 (186) Apply 2017 filter
- 2016 (191) Apply 2016 filter
- 2015 (195) Apply 2015 filter
- 2014 (190) Apply 2014 filter
- 2013 (136) Apply 2013 filter
- 2012 (112) Apply 2012 filter
- 2011 (98) Apply 2011 filter
- 2010 (61) Apply 2010 filter
- 2009 (56) Apply 2009 filter
- 2008 (40) Apply 2008 filter
- 2007 (21) Apply 2007 filter
- 2006 (3) Apply 2006 filter
2896 Janelia Publications
Showing 1841-1850 of 2896 results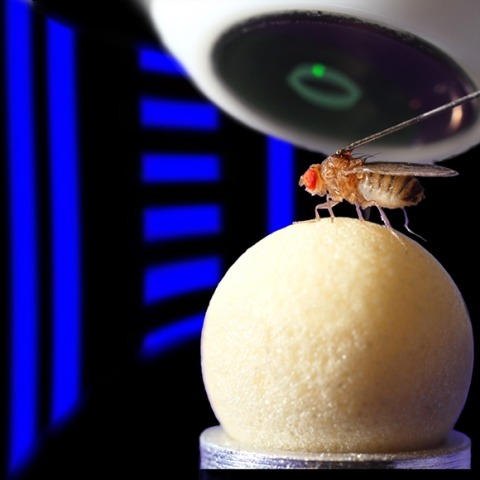
Many animals navigate using a combination of visual landmarks and path integration. In mammalian brains, head direction cells integrate these two streams of information by representing an animal's heading relative to landmarks, yet maintaining their directional tuning in darkness based on self-motion cues. Here we use two-photon calcium imaging in head-fixed Drosophila melanogaster walking on a ball in a virtual reality arena to demonstrate that landmark-based orientation and angular path integration are combined in the population responses of neurons whose dendrites tile the ellipsoid body, a toroidal structure in the centre of the fly brain. The neural population encodes the fly's azimuth relative to its environment, tracking visual landmarks when available and relying on self-motion cues in darkness. When both visual and self-motion cues are absent, a representation of the animal's orientation is maintained in this network through persistent activity, a potential substrate for short-term memory. Several features of the population dynamics of these neurons and their circular anatomical arrangement are suggestive of ring attractors, network structures that have been proposed to support the function of navigational brain circuits.
Most behaviors involve neural dynamics in high-dimensional activity spaces. A common approach is to extract dimensions that capture task-related variability, such as those separating stimuli or choices, yielding low-dimensional, task-aligned neural activity subspaces (“coding dimensions”). However, whether these dimensions actively drive decisions or merely reflect underlying computations remains unclear. Moreover, neural activity outside these coding subspaces (“residual dimensions”) is often ignored, though it could also causally shape neural dynamics driving behavior. We developed a recurrent neural network model that fits population activity and uncovers the dynamic interactions between coding and residual subspaces on single trials. Applied to electrophysiological recordings from the anterior lateral motor cortex (ALM) and motor thalamus in mice performing a delayed response task, our model demonstrates that perturbations of residual dimensions reliably alter behavioral choices, whereas perturbations of the choice dimension, which strongly encodes the animal’s upcoming decision, are largely ineffective. These perturbation effects arise because residual dimensions drive transient amplification across an intermediate number of coding and residual dimensions (\~10), before the dynamics collapse into discrete attractor states corresponding to the animal’s choice. By dissecting the low-dimensional variability underlying error trials, we find that it primarily shifts trajectories along residual dimensions, biasing single decisions. Residual activity in thalamus shapes cortical decision dynamics, implicating weakly selective thalamic populations in the emergence of cortical selectivity. Our findings challenge the conventional focus on low-dimensional coding subspaces as sufficient framework for understanding neural computations, demonstrating that dimensions previously considered task-irrelevant and accounting for little variance can have a critical role in driving behavior.
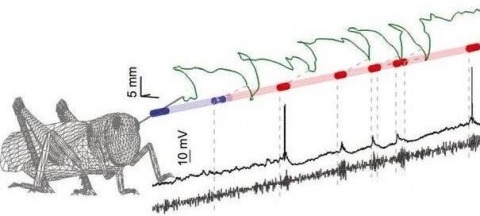
Sensory inputs are often fluctuating and intermittent, yet animals reliably utilize them to direct behavior. Here we ask how natural stimulus fluctuations influence the dynamic neural encoding of odors. Using the locust olfactory system, we isolated two main causes of odor intermittency: chaotic odor plumes and active sampling behaviors. Despite their irregularity, chaotic odor plumes still drove dynamic neural response features including the synchronization, temporal patterning, and short-term plasticity of spiking in projection neurons, enabling classifier-based stimulus identification and activating downstream decoders (Kenyon cells). Locusts can also impose odor intermittency through active sampling movements with their unrestrained antennae. Odors triggered immediate, spatially targeted antennal scanning that, paradoxically, weakened individual neural responses. However, these frequent but weaker responses were highly informative about stimulus location. Thus, not only are odor-elicited dynamic neural responses compatible with natural stimulus fluctuations and important for stimulus identification, but locusts actively increase intermittency, possibly to improve stimulus localization.
It is unclear where in the nervous system evolutionary changes tend to occur. To localize the source of neural evolution that has generated divergent behaviors, we developed a new approach to label and functionally manipulate homologous neurons across Drosophila species. We examined homologous descending neurons that drive courtship song in two species that sing divergent song types and localized relevant evolutionary changes in circuit function downstream of the intrinsic physiology of these descending neurons. This evolutionary change causes different species to produce divergent motor patterns in similar social contexts. Artificial stimulation of these descending neurons drives multiple song types, suggesting that multifunctional properties of song circuits may facilitate rapid evolution of song types.
Neurons in motor cortex and connected brain regions fire in anticipation of specific movements, long before movement occurs. This neural activity reflects internal processes by which the brain plans and executes volitional movements. The study of motor planning offers an opportunity to understand how the structure and dynamics of neural circuits support persistent internal states and how these states influence behavior. Recent advances in large-scale neural recordings are beginning to decipher the relationship of the dynamics of populations of neurons during motor planning and movements. New behavioral tasks in rodents, together with quantified perturbations, link dynamics in specific nodes of neural circuits to behavior. These studies reveal a neural network distributed across multiple brain regions that collectively supports motor planning. We review recent advances and highlight areas where further work is needed to achieve a deeper understanding of the mechanisms underlying motor planning and related cognitive processes.
Human memory can store large amount of information. Nevertheless, recalling is often a challenging task. In a classical free recall paradigm, where participants are asked to repeat a briefly presented list of words, people make mistakes for lists as short as 5 words. We present a model for memory retrieval based on a Hopfield neural network where transition between items are determined by similarities in their long-term memory representations. Meanfield analysis of the model reveals stable states of the network corresponding (1) to single memory representations and (2) intersection between memory representations. We show that oscillating feedback inhibition in the presence of noise induces transitions between these states triggering the retrieval of different memories. The network dynamics qualitatively predicts the distribution of time intervals required to recall new memory items observed in experiments. It shows that items having larger number of neurons in their representation are statistically easier to recall and reveals possible bottlenecks in our ability of retrieving memories. Overall, we propose a neural network model of information retrieval broadly compatible with experimental observations and is consistent with our recent graphical model (Romani et al., 2013).
Animals communicate using sounds in a wide range of contexts, and auditory systems must encode behaviorally relevant acoustic features to drive appropriate reactions. How feature detection emerges along auditory pathways has been difficult to solve due to challenges in mapping the underlying circuits and characterizing responses to behaviorally relevant features. Here, we study auditory activity in the Drosophila melanogaster brain and investigate feature selectivity for the two main modes of fly courtship song, sinusoids and pulse trains. We identify 24 new cell types of the intermediate layers of the auditory pathway, and using a new connectomic resource, FlyWire, we map all synaptic connections between these cell types, in addition to connections to known early and higher-order auditory neurons-this represents the first circuit-level map of the auditory pathway. We additionally determine the sign (excitatory or inhibitory) of most synapses in this auditory connectome. We find that auditory neurons display a continuum of preferences for courtship song modes and that neurons with different song-mode preferences and response timescales are highly interconnected in a network that lacks hierarchical structure. Nonetheless, we find that the response properties of individual cell types within the connectome are predictable from their inputs. Our study thus provides new insights into the organization of auditory coding within the Drosophila brain.
BACKGROUND: During courtship, male Drosophila melanogaster sing a multipart courtship song to female flies. This song is of particular interest because (1) it is species specific and varies widely within the genus, (2) it is a gating stimulus for females, who are sensitive detectors of conspecific song, and (3) it is the only sexual signal that is under both neural and genetic control. This song is perceived via mechanosensory neurons in the antennal Johnston's organ, which innervate the antennal mechanosensory and motor center (AMMC) of the brain. However, AMMC outputs that are responsible for detection and discrimination of conspecific courtship song remain unknown. RESULTS: Using a large-scale anatomical screen of AMMC interneurons, we identify seven projection neurons (aPNs) and five local interneurons (aLNs) that outline a complex architecture for the ascending mechanosensory pathway. Neuronal inactivation and hyperactivation during behavior reveal that only two classes of interneurons are necessary for song responses--the projection neuron aPN1 and GABAergic interneuron aLN(al). These neurons are necessary in both male and female flies. Physiological recordings in aPN1 reveal the integration of courtship song as a function of pulse rate and outline an intracellular transfer function that likely facilitates the response to conspecific song. CONCLUSIONS: These results reveal a critical pathway for courtship hearing in male and female flies, in which both aLN(al) and aPN1 mediate the detection of conspecific song. The pathways arising from these neurons likely serve as a critical neural substrate for behavioral reproductive isolation in D. melanogaster.

Midbrain dopaminergic (DA) neurons are thought to guide learning via phasic elevations of firing in response to reward predicting stimuli. The mechanism for these signals remains unclear. Using extracellular recording during associative learning, we found that inhibitory neurons in the ventral midbrain of mice responded to salient auditory stimuli with a burst of activity that occurred before the onset of the phasic response of DA neurons. This population of inhibitory neurons exhibited enhanced responses during extinction and was anticorrelated with the phasic response of simultaneously recorded DA neurons. Optogenetic stimulation revealed that this population was, in part, derived from inhibitory projection neurons of the substantia nigra that provide a robust monosynaptic inhibition of DA neurons. Thus, our results elaborate on the dynamic upstream circuits that shape the phasic activity of DA neurons and suggest that the inhibitory microcircuit of the midbrain is critical for new learning in extinction.
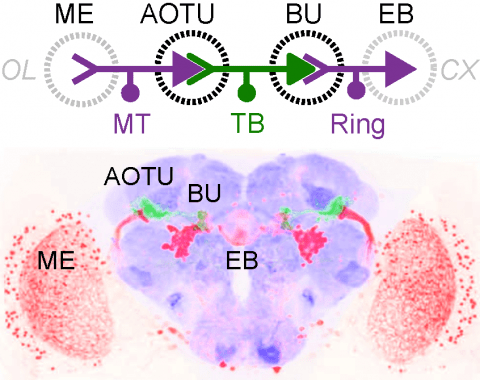
Many animals orient using visual cues, but how a single cue is selected from among many is poorly understood. Here we show that Drosophila ring neurons—central brain neurons implicated in navigation—display visual stimulus selection. Using in vivo two-color two-photon imaging with genetically encoded calcium indicators, we demonstrate that individual ring neurons inherit simple-cell-like receptive fields from their upstream partners. Stimuli in the contralateral visual field suppressed responses to ipsilateral stimuli in both populations. Suppression strength depended on when and where the contralateral stimulus was presented, an effect stronger in ring neurons than in their upstream inputs. This history-dependent effect on the temporal structure of visual responses, which was well modeled by a simple biphasic filter, may determine how visual references are selected for the fly's internal compass. Our approach highlights how two-color calcium imaging can help identify and localize the origins of sensory transformations across synaptically connected neural populations.