Filter
Associated Lab
- Aguilera Castrejon Lab (1) Apply Aguilera Castrejon Lab filter
- Ahrens Lab (53) Apply Ahrens Lab filter
- Aso Lab (40) Apply Aso Lab filter
- Baker Lab (19) Apply Baker Lab filter
- Betzig Lab (101) Apply Betzig Lab filter
- Beyene Lab (8) Apply Beyene Lab filter
- Bock Lab (14) Apply Bock Lab filter
- Branson Lab (50) Apply Branson Lab filter
- Card Lab (36) Apply Card Lab filter
- Cardona Lab (45) Apply Cardona Lab filter
- Chklovskii Lab (10) Apply Chklovskii Lab filter
- Clapham Lab (14) Apply Clapham Lab filter
- Cui Lab (19) Apply Cui Lab filter
- Darshan Lab (8) Apply Darshan Lab filter
- Dickson Lab (32) Apply Dickson Lab filter
- Druckmann Lab (21) Apply Druckmann Lab filter
- Dudman Lab (38) Apply Dudman Lab filter
- Eddy/Rivas Lab (30) Apply Eddy/Rivas Lab filter
- Egnor Lab (4) Apply Egnor Lab filter
- Espinosa Medina Lab (15) Apply Espinosa Medina Lab filter
- Feliciano Lab (7) Apply Feliciano Lab filter
- Fetter Lab (31) Apply Fetter Lab filter
- Fitzgerald Lab (16) Apply Fitzgerald Lab filter
- Freeman Lab (15) Apply Freeman Lab filter
- Funke Lab (38) Apply Funke Lab filter
- Gonen Lab (59) Apply Gonen Lab filter
- Grigorieff Lab (34) Apply Grigorieff Lab filter
- Harris Lab (53) Apply Harris Lab filter
- Heberlein Lab (13) Apply Heberlein Lab filter
- Hermundstad Lab (22) Apply Hermundstad Lab filter
- Hess Lab (74) Apply Hess Lab filter
- Ilanges Lab (2) Apply Ilanges Lab filter
- Jayaraman Lab (42) Apply Jayaraman Lab filter
- Ji Lab (33) Apply Ji Lab filter
- Johnson Lab (1) Apply Johnson Lab filter
- Karpova Lab (13) Apply Karpova Lab filter
- Keleman Lab (8) Apply Keleman Lab filter
- Keller Lab (61) Apply Keller Lab filter
- Koay Lab (2) Apply Koay Lab filter
- Lavis Lab (137) Apply Lavis Lab filter
- Lee (Albert) Lab (29) Apply Lee (Albert) Lab filter
- Leonardo Lab (19) Apply Leonardo Lab filter
- Li Lab (4) Apply Li Lab filter
- Lippincott-Schwartz Lab (97) Apply Lippincott-Schwartz Lab filter
- Liu (Yin) Lab (1) Apply Liu (Yin) Lab filter
- Liu (Zhe) Lab (58) Apply Liu (Zhe) Lab filter
- Looger Lab (137) Apply Looger Lab filter
- Magee Lab (31) Apply Magee Lab filter
- Menon Lab (12) Apply Menon Lab filter
- Murphy Lab (6) Apply Murphy Lab filter
- O'Shea Lab (6) Apply O'Shea Lab filter
- Otopalik Lab (1) Apply Otopalik Lab filter
- Pachitariu Lab (36) Apply Pachitariu Lab filter
- Pastalkova Lab (5) Apply Pastalkova Lab filter
- Pavlopoulos Lab (7) Apply Pavlopoulos Lab filter
- Pedram Lab (4) Apply Pedram Lab filter
- Podgorski Lab (16) Apply Podgorski Lab filter
- Reiser Lab (45) Apply Reiser Lab filter
- Riddiford Lab (20) Apply Riddiford Lab filter
- Romani Lab (31) Apply Romani Lab filter
- Rubin Lab (105) Apply Rubin Lab filter
- Saalfeld Lab (46) Apply Saalfeld Lab filter
- Satou Lab (1) Apply Satou Lab filter
- Scheffer Lab (36) Apply Scheffer Lab filter
- Schreiter Lab (50) Apply Schreiter Lab filter
- Sgro Lab (1) Apply Sgro Lab filter
- Shroff Lab (31) Apply Shroff Lab filter
- Simpson Lab (18) Apply Simpson Lab filter
- Singer Lab (37) Apply Singer Lab filter
- Spruston Lab (57) Apply Spruston Lab filter
- Stern Lab (73) Apply Stern Lab filter
- Sternson Lab (47) Apply Sternson Lab filter
- Stringer Lab (32) Apply Stringer Lab filter
- Svoboda Lab (131) Apply Svoboda Lab filter
- Tebo Lab (9) Apply Tebo Lab filter
- Tervo Lab (9) Apply Tervo Lab filter
- Tillberg Lab (18) Apply Tillberg Lab filter
- Tjian Lab (17) Apply Tjian Lab filter
- Truman Lab (58) Apply Truman Lab filter
- Turaga Lab (39) Apply Turaga Lab filter
- Turner Lab (27) Apply Turner Lab filter
- Vale Lab (7) Apply Vale Lab filter
- Voigts Lab (3) Apply Voigts Lab filter
- Wang (Meng) Lab (21) Apply Wang (Meng) Lab filter
- Wang (Shaohe) Lab (6) Apply Wang (Shaohe) Lab filter
- Wu Lab (8) Apply Wu Lab filter
- Zlatic Lab (26) Apply Zlatic Lab filter
- Zuker Lab (5) Apply Zuker Lab filter
Associated Project Team
- CellMap (12) Apply CellMap filter
- COSEM (3) Apply COSEM filter
- FIB-SEM Technology (3) Apply FIB-SEM Technology filter
- Fly Descending Interneuron (11) Apply Fly Descending Interneuron filter
- Fly Functional Connectome (14) Apply Fly Functional Connectome filter
- Fly Olympiad (5) Apply Fly Olympiad filter
- FlyEM (53) Apply FlyEM filter
- FlyLight (49) Apply FlyLight filter
- GENIE (46) Apply GENIE filter
- Integrative Imaging (4) Apply Integrative Imaging filter
- Larval Olympiad (2) Apply Larval Olympiad filter
- MouseLight (18) Apply MouseLight filter
- NeuroSeq (1) Apply NeuroSeq filter
- ThalamoSeq (1) Apply ThalamoSeq filter
- Tool Translation Team (T3) (26) Apply Tool Translation Team (T3) filter
- Transcription Imaging (45) Apply Transcription Imaging filter
Associated Support Team
- Project Pipeline Support (5) Apply Project Pipeline Support filter
- Anatomy and Histology (18) Apply Anatomy and Histology filter
- Cryo-Electron Microscopy (35) Apply Cryo-Electron Microscopy filter
- Electron Microscopy (16) Apply Electron Microscopy filter
- Gene Targeting and Transgenics (11) Apply Gene Targeting and Transgenics filter
- Integrative Imaging (17) Apply Integrative Imaging filter
- Invertebrate Shared Resource (40) Apply Invertebrate Shared Resource filter
- Janelia Experimental Technology (37) Apply Janelia Experimental Technology filter
- Management Team (1) Apply Management Team filter
- Molecular Genomics (15) Apply Molecular Genomics filter
- Primary & iPS Cell Culture (14) Apply Primary & iPS Cell Culture filter
- Project Technical Resources (50) Apply Project Technical Resources filter
- Quantitative Genomics (19) Apply Quantitative Genomics filter
- Scientific Computing Software (92) Apply Scientific Computing Software filter
- Scientific Computing Systems (7) Apply Scientific Computing Systems filter
- Viral Tools (14) Apply Viral Tools filter
- Vivarium (7) Apply Vivarium filter
Publication Date
- 2025 (124) Apply 2025 filter
- 2024 (215) Apply 2024 filter
- 2023 (159) Apply 2023 filter
- 2022 (167) Apply 2022 filter
- 2021 (175) Apply 2021 filter
- 2020 (177) Apply 2020 filter
- 2019 (177) Apply 2019 filter
- 2018 (206) Apply 2018 filter
- 2017 (186) Apply 2017 filter
- 2016 (191) Apply 2016 filter
- 2015 (195) Apply 2015 filter
- 2014 (190) Apply 2014 filter
- 2013 (136) Apply 2013 filter
- 2012 (112) Apply 2012 filter
- 2011 (98) Apply 2011 filter
- 2010 (61) Apply 2010 filter
- 2009 (56) Apply 2009 filter
- 2008 (40) Apply 2008 filter
- 2007 (21) Apply 2007 filter
- 2006 (3) Apply 2006 filter
2689 Janelia Publications
Showing 2261-2270 of 2689 resultsObjective: While the contribution of α-Synuclein to neurodegeneration in Parkinson’s disease is well accepted, the putative impact of its close homologue, β-Synuclein, is enigmatic. β-Synuclein is widely expressed throughout the central nervous system as is α-Synuclein, but the physiological functions of both proteins remain unknown. Recent findings supported the view that β-Synuclein can act as an ameliorating regulator of α-Synuclein-induced neurotoxicity, having neuroprotective rather than neurodegenerative capabilities, and being non-aggregating due to absence of most part of the aggregation-promoting NAC domain. However, a mutation of β-Synuclein linked to dementia with Lewy bodies rendered the protein neurotoxic in transgenic mice and fibrillation of β-Synuclein has been demonstrated in vitro. Methods / Results: Supporting the hypothesis that β-Synuclein can act as a neurodegeneration-inducing factor we now demonstrate that wild-type β-Synuclein is neurotoxic for cultured primary neurons. Furthermore, β-Synuclein formed proteinase K resistant aggregates in dopaminergic neurons in vivo, leading to pronounced and progressive neurodegeneration in rats. Expression of β-Synuclein caused mitochondrial fragmentation, but this fragmentation did not render mitochondria non-functional in terms of ion handling and respiration even in late stages of neurodegeneration. A comparison of the neurodegenerative effects induced by α-, β-, and γ-Synuclein revealed that β-Synuclein was eventually as neurotoxic as α-Synuclein for nigral dopaminergic neurons, while γ-Synuclein proved to be non-toxic and had very low aggregation propensity. Interpretation: Our results suggest that the role of β-Synuclein as a putative modulator of neuropathology in aggregopathies like Parkinson’s disease and dementia with Lewy bodies needs to be revisited. ANN NEUROL 2013. © 2013 American Neurological Association.
Neuroscience is at a crossroads. Great effort is being invested into deciphering specific neural interactions and circuits. At the same time, there exist few general theories or principles that explain brain function. We attribute this disparity, in part, to limitations in current methodologies. Traditional neurophysiological approaches record the activities of one neuron or a few neurons at a time. Neurochemical approaches focus on single neurotransmitters. Yet, there is an increasing realization that neural circuits operate at emergent levels, where the interactions between hundreds or thousands of neurons, utilizing multiple chemical transmitters, generate functional states. Brains function at the nanoscale, so tools to study brains must ultimately operate at this scale, as well. Nanoscience and nanotechnology are poised to provide a rich toolkit of novel methods to explore brain function by enabling simultaneous measurement and manipulation of activity of thousands or even millions of neurons. We and others refer to this goal as the Brain Activity Mapping Project. In this Nano Focus, we discuss how recent developments in nanoscale analysis tools and in the design and synthesis of nanomaterials have generated optical, electrical, and chemical methods that can readily be adapted for use in neuroscience. These approaches represent exciting areas of technical development and research. Moreover, unique opportunities exist for nanoscientists, nanotechnologists, and other physical scientists and engineers to contribute to tackling the challenging problems involved in understanding the fundamentals of brain function.
Developmental signals such as Wnts are often presented to cells in an oriented manner. To examine the consequences of local Wnt signaling, we immobilized Wnt proteins on beads and introduced them to embryonic stem cells in culture. At the single-cell level, the Wnt-bead induced asymmetric distribution of Wnt-β-catenin signaling components, oriented the plane of mitotic division, and directed asymmetric inheritance of centrosomes. Before cytokinesis was completed, the Wnt-proximal daughter cell expressed high levels of nuclear β-catenin and pluripotency genes, whereas the distal daughter cell acquired hallmarks of differentiation. We suggest that a spatially restricted Wnt signal induces an oriented cell division that generates distinct cell fates at predictable positions relative to the Wnt source.
Automatic 3D digital reconstruction (tracing) of neurons embedded in noisy microscopic images is challenging, especially when the cell morphology is complex.
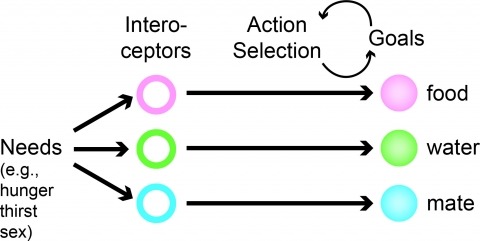
Neural processes that direct an animal’s actions toward environmental goals are critical elements for understanding behavior. The hypothalamus is closely associated with motivated behaviors required for survival and reproduction. Intense feeding, drinking, aggressive, and sexual behaviors can be produced by a simple neuronal stimulus applied to discrete hypothalamic regions. What can these "evoked behaviors" teach us about the neural processes that determine behavioral intent and intensity? Small populations of neurons sufficient to evoke a complex motivated behavior may be used as entry points to identify circuits that energize and direct behavior to specific goals. Here, I review recent applications of molecular genetic, optogenetic, and pharmacogenetic approaches that overcome previous limitations for analyzing anatomically complex hypothalamic circuits and their interactions with the rest of the brain. These new tools have the potential to bridge the gaps between neurobiological and psychological thinking about the mechanisms of complex motivated behavior.
Genetically encoded calcium indicators (GECIs) are powerful tools for systems neuroscience. Here we describe red, single-wavelength GECIs, "RCaMPs," engineered from circular permutation of the thermostable red fluorescent protein mRuby. High-resolution crystal structures of mRuby, the red sensor RCaMP, and the recently published red GECI R-GECO1 give insight into the chromophore environments of the Ca(2+)-bound state of the sensors and the engineered protein domain interfaces of the different indicators. We characterized the biophysical properties and performance of RCaMP sensors in vitro and in vivo in Caenorhabditis elegans, Drosophila larvae, and larval zebrafish. Further, we demonstrate 2-color calcium imaging both within the same cell (registering mitochondrial and somatic [Ca(2+)]) and between two populations of cells: neurons and astrocytes. Finally, we perform integrated optogenetics experiments, wherein neural activation via channelrhodopsin-2 (ChR2) or a red-shifted variant, and activity imaging via RCaMP or GCaMP, are conducted simultaneously, with the ChR2/RCaMP pair providing independently addressable spectral channels. Using this paradigm, we measure calcium responses of naturalistic and ChR2-evoked muscle contractions in vivo in crawling C. elegans. We systematically compare the RCaMP sensors to R-GECO1, in terms of action potential-evoked fluorescence increases in neurons, photobleaching, and photoswitching. R-GECO1 displays higher Ca(2+) affinity and larger dynamic range than RCaMP, but exhibits significant photoactivation with blue and green light, suggesting that integrated channelrhodopsin-based optogenetics using R-GECO1 may be subject to artifact. Finally, we create and test blue, cyan, and yellow variants engineered from GCaMP by rational design. This engineered set of chromatic variants facilitates new experiments in functional imaging and optogenetics.
Smart camera networks have recently emerged as a new class of sensor network infrastructure that is capable of supporting high-power in-network signal processing and enabling a wide range of applications. In this article, we provide an exposition of our efforts to build a low-bandwidth wireless camera network platform, called CITRIC, and its applications in smart camera networks. The platform integrates a camera, a microphone, a frequency-scalable (up to 624 MHz) CPU, 16 MB FLASH, and 64 MB RAM onto a single device. The device then connects with a standard sensor network mote to form a wireless camera mote. With reasonably low power consumption and extensive algorithmic libraries running on a decent operating system that is easy to program, CITRIC is ideal for research and applications in distributed image and video processing. Its capabilities of in-network image processing also reduce communication requirements, which has been high in other existing camera networks with centralized processing. Furthermore, the mote easily integrates with other low-bandwidth sensor networks via the IEEE 802.15.4 protocol. To justify the utility of CITRIC, we present several representative applications. In particular, concrete research results will be demonstrated in two areas, namely, distributed coverage hole identification and distributed object recognition.
Visualization of cellular and molecular processes is an indispensable tool for cell biologists, and innovations in microscopy methods unfailingly lead to new biological discoveries. Today, light microscopy (LM) provides ever-higher spatial and temporal resolution and visualization of biological process over enormous ranges. Electron microscopy (EM) is moving into the atomic resolution regime and allowing cellular analyses that are more physiological and sophisticated in scope. Importantly, much is being gained by combining multiple approaches, (e.g., LM and EM) to take advantage of their complementary strengths. The advent of high-throughput microscopies has led to a common need for sophisticated computational methods to quantitatively analyze huge amounts of data and translate images into new biological insights.
We are interested in establishing the correspondence between neuron activity and body curvature during various movements of C. Elegans worms. Given long sequences of images, specifically recorded to glow when the neuron is active, it is required to track all identifiable neurons in each frame. The characteristics of the neuron data, e.g., the uninformative nature of neuron appearance and the sequential ordering of neurons, renders standard single and multi-object tracking methods either ineffective or unnecessary for our task. In this paper, we propose a multi-target tracking algorithm that correctly assigns each neuron to one of several candidate locations in the next frame preserving shape constraint. The results demonstrate how the proposed method can robustly track more neurons than several existing methods in long sequences of images.
Cerebellar granule cells constitute the majority of neurons in the brain and are the primary conveyors of sensory and motor-related mossy fiber information to Purkinje cells. The functional capability of the cerebellum hinges on whether individual granule cells receive mossy fiber inputs from multiple precerebellar nuclei or are instead unimodal; this distinction is unresolved. Using cell-type-specific projection mapping with synaptic resolution, we observed the convergence of separate sensory (upper body proprioceptive) and basilar pontine pathways onto individual granule cells and mapped this convergence across cerebellar cortex. These findings inform the long-standing debate about the multimodality of mammalian granule cells and substantiate their associative capacity predicted in the Marr-Albus theory of cerebellar function. We also provide evidence that the convergent basilar pontine pathways carry corollary discharges from upper body motor cortical areas. Such merging of related corollary and sensory streams is a critical component of circuit models of predictive motor control. DOI:http://dx.doi.org/10.7554/eLife.00400.001.