JAABA: The Janelia Automatic Animal Behavior Annotator
We have developed a new machine learning-based system, JAABA, to enable researchers to automatically compute highly descriptive, interpretable, quantitative statistics of the behavior of animals. Through our system, the user encodes their intuition about the structure of behavior in their experiment by labeling the behavior of the animal, e.g. walking, grooming, or chasing, in a small set of video frames. JAABA uses machine learning techniques to convert these manual labels into behavior detectors that can then be used to automatically classify the behaviors of the animals in a large data set with high throughput. JAABA combines a powerful, fast machine learning method, an intuitive interface, and visualizations of the classifier to create an interactive, usable, general-purpose tool for training behavior classifiers. Combined with automatic tracking algorithms such as Ctrax, we envision that it will enable biologists to transform a qualitative understanding about behavioral differences into a quantitative statistic, then systematically look for signals only detectable through automatic, high-throughput, quantitative analysis.
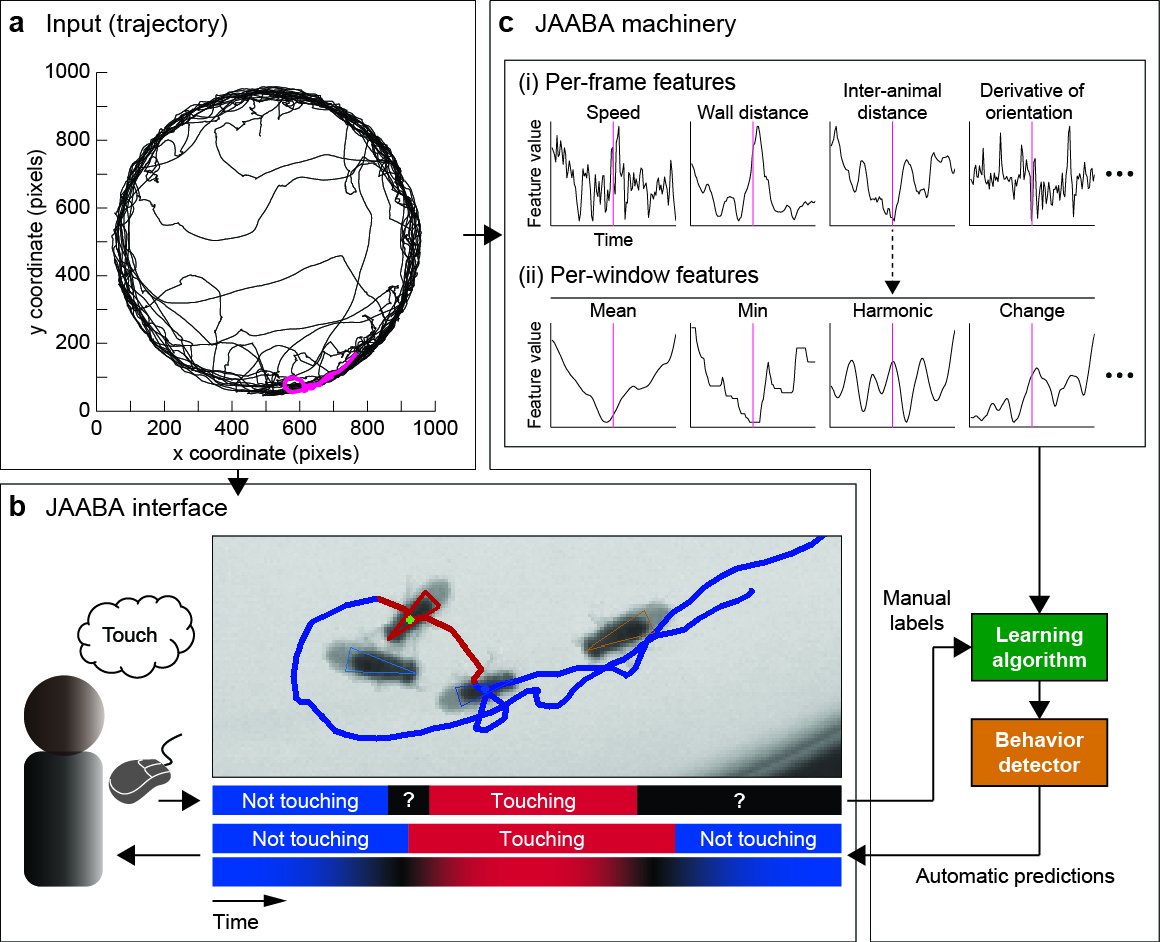
JAABA Overview (a) Input trajectory for one fly over 1000s. (b) JAABA interface. The user is shown video of the animal overlaid with the current animal’s tracked position and trajectory. The top timeline shows frames labeled by the user. The bottom timelines show the classifier's predictions and confidence. (c) JAABA machinery. The underlying JAABA machinery transforms the input trajectories into a general-purpose, high-dimensional representation engineered for speed. These "window features" and the manual behavior labels are the input to the machine learning algorithm.
Through a series of groundtruthing experiments, we showed that our system can be used by scientists without expertise in machine learning to independently train accurate behavior detectors. JAABA is general purpose, and we showed that it can be used to easily create a wide variety of accurate individual and social behavior detectors for three important model organisms: flies, larvae, and mice. We also showed that it can be used to create behavior classifiers robust enough to successfully be applied to a large, phenotypically diverse data: our neural activation screen data.
To create a new behavior classifier, the user begins by labeling the behavior of animals in a small number of frames in which they are certain of the correct behavior label. They then push the "Train" button to pass these labels to the machine learning algorithm, which, within a few seconds, creates an initial behavior classifier that predicts the behavior label in all frames. The user can then examine these results, and find and label frames for which the classifier is predicting incorrectly, and the user is confident of the correct label. They can then retrain the classifier, and repeat.
Screencast of beginning to train a wing grooming classifier using JAABA.
JAABA is a practical implementation of active learning, a subfield of machine learning in which only the most informative training examples are labeled. Traditionally, these are the unlabeled examples on which the current classifier is most unsure. Because of the fuzzy nature of behavior, frames on which the classifier is unsure are often frames for which the behavior label is truly ambiguous. Thus, we instead employ an interactive approach in which the user, aided by visualization and navigation tools for sifting through sets of videos of hundreds of animals and millions of frames, finds and labels frames for which they are certain of the correct label and the current classifier predicts incorrectly. This JAABA interface also increases the communication between the user and the learning algorithm, and allows users with little knowledge of machine learning to understand what the algorithm is capable of, and diagnose why a classifier is misclassifying a given frame.
The Fly Bowl behavior quantification system
We have developed a high-throughput system for quantifying the locomotion and social behavior of flies with both breadth and depth. This system was developed as part of the Fly Olympiad project at Janelia. We screened the behavioral effects of TrpA neural activation at a rate of 75 GAL4 lines per week over a period of 1.5 years.
In our system, we record video of groups of flies freely behaving in an open-field walking arena, the Fly Bowl. The Fly Bowl is a chamber for observing the locomotion and social behaviors of multiple flies. Its main difference from more standard arenas is that it was designed with automated tracking and behavior analysis algorithms in mind. We have made significant modifications to the original design to increase throughput, consistency, and image quality. These modifications allow us to use Ctrax to track individual flies’ positions accurately in a completely automated way. Our system consists of 8 bowls that we record from simultaneously.
To reduce disk storage, we developed a MATLAB-based data capture system which compresses our videos by a factor of 80 during recording and is lossless for the tracking algorithm (in our screen, we capture 11 TB of raw video data per week). Our data capture system also captures and monitors metadata information about the environment and the preparation of the flies to ensure that results are repeatable and data are comparable over long periods of time across the different rigs.
To provide oversight for collection of this large data set, we developed visualization tools for examining the stability of experimental conditions and behavior statistics over time, and ensuring that we understood and accounted for correlations between recorded metadata and behavior.
To analyze the data, we developed an automatic pipeline that uses the cluster at Janelia. Typically, data are analyzed within 24-hours of being collected and the results are stored in a database. The first step in our analysis is to track the positions of individual flies using an updated version of Ctrax. From the trajectories, we compute 85 time series of “per-frame” behavior measurements, for instance the fly’s speed in each frame, or the distance from the fly to the closest other fly in each frame. Our first level of characterization of the behavior of the flies are statistics of these measurements, in these examples, the average speed and the average distance to the closest fly, or histograms of these values.
Next, we use behavior classifiers trained using JAABA to compute discrete behavior labels for each fly and frame, labels of whether the fly is or is not performing each of a suite of behaviors, e.g. walking, chasing, and wing grooming. We can then represent the behavior of the flies in terms of the fraction of time that they perform a given behavior. We can also use these discrete behavior categories to segment the trajectories into similar types of data that can be analyzed together. Then, we can look at statistics of our per-frame measurements within these segments, e.g. average speed while chasing, or distance to the closest fly at the beginning of a jump. This allows us to remove the effects of common behaviors such as walking and stopping when scrutinizing less common but highly stereotyped behaviors such as courtship and grooming.
Mapping behavior to anatomy using thermogenetics
Results of our screen are available here.
To understand the relationship between neural anatomy and behavior, the ultimate output of the nervous system, we performed a high-throughput, thermogenetic screen of 2,200 transgenic Drosophila lines from the Janelia GAL4 collection. Each GAL4 line drives expression in a different, sparse subset of neurons in the fly nervous system. Using genetic techniques, we selectively activated these sparse subsets of neurons, and measured the behavioral effects. We used JAABA and the Fly Bowl behavior assay described above to automatically measure the flies' locomotion and social behavior with breadth and depth. We recorded 20,000 videos of groups of flies freely behaving in an open-field walking arena, totaling ~400 TB of raw data. From the video, we tracked the flies' body and wing positions using our tracking software, Ctrax. We used JAABA to create 15 behavior classifiers (e.g. walking, chasing) that input trajectories from Ctrax and output predictions for each frame of each fly's behaviors (totaling ~175 billion annotations of behavior). For each line of flies, we computed ~200 behavior statistics, such as the fraction of time spent chasing, or average speed while walking, summarizing the behavioral effects of activating the targeted neurons in a concise, interpretable manner.
Concurrent with our screen, the Janelia FlyLight project imaged the expression pattern of each GAL4 line, producing image stacks indicating which neurons are likely being activated in each line. By jointly analyzing these behavior and anatomy measurements, we created brain-behavior maps suggesting neural substrates for the generation and/or regulation of each behavior. This study is groundbreaking on two technological fronts. It represents the application of video-based behavior recognition to a highly phenotypically diverse data set of thousands of Drosophila genotypes, and the largest unbiased screen to assign function to neurons throughout the nervous system.