Filter
Associated Lab
- Ahrens Lab (3) Apply Ahrens Lab filter
- Aso Lab (3) Apply Aso Lab filter
- Baker Lab (5) Apply Baker Lab filter
- Betzig Lab (8) Apply Betzig Lab filter
- Branson Lab (6) Apply Branson Lab filter
- Card Lab (1) Apply Card Lab filter
- Cardona Lab (1) Apply Cardona Lab filter
- Chklovskii Lab (2) Apply Chklovskii Lab filter
- Cui Lab (2) Apply Cui Lab filter
- Darshan Lab (1) Apply Darshan Lab filter
- Dickson Lab (6) Apply Dickson Lab filter
- Druckmann Lab (1) Apply Druckmann Lab filter
- Dudman Lab (4) Apply Dudman Lab filter
- Eddy/Rivas Lab (3) Apply Eddy/Rivas Lab filter
- Egnor Lab (1) Apply Egnor Lab filter
- Fetter Lab (1) Apply Fetter Lab filter
- Fitzgerald Lab (1) Apply Fitzgerald Lab filter
- Freeman Lab (3) Apply Freeman Lab filter
- Gonen Lab (10) Apply Gonen Lab filter
- Grigorieff Lab (3) Apply Grigorieff Lab filter
- Harris Lab (2) Apply Harris Lab filter
- Heberlein Lab (2) Apply Heberlein Lab filter
- Hermundstad Lab (2) Apply Hermundstad Lab filter
- Hess Lab (5) Apply Hess Lab filter
- Jayaraman Lab (1) Apply Jayaraman Lab filter
- Ji Lab (3) Apply Ji Lab filter
- Johnson Lab (1) Apply Johnson Lab filter
- Kainmueller Lab (2) Apply Kainmueller Lab filter
- Karpova Lab (1) Apply Karpova Lab filter
- Keller Lab (8) Apply Keller Lab filter
- Lavis Lab (7) Apply Lavis Lab filter
- Lee (Albert) Lab (4) Apply Lee (Albert) Lab filter
- Leonardo Lab (4) Apply Leonardo Lab filter
- Li Lab (1) Apply Li Lab filter
- Lippincott-Schwartz Lab (12) Apply Lippincott-Schwartz Lab filter
- Liu (Zhe) Lab (4) Apply Liu (Zhe) Lab filter
- Looger Lab (11) Apply Looger Lab filter
- Magee Lab (1) Apply Magee Lab filter
- Menon Lab (3) Apply Menon Lab filter
- Murphy Lab (1) Apply Murphy Lab filter
- Pavlopoulos Lab (2) Apply Pavlopoulos Lab filter
- Reiser Lab (2) Apply Reiser Lab filter
- Riddiford Lab (4) Apply Riddiford Lab filter
- Romani Lab (2) Apply Romani Lab filter
- Rubin Lab (9) Apply Rubin Lab filter
- Saalfeld Lab (1) Apply Saalfeld Lab filter
- Scheffer Lab (7) Apply Scheffer Lab filter
- Sgro Lab (1) Apply Sgro Lab filter
- Simpson Lab (2) Apply Simpson Lab filter
- Singer Lab (10) Apply Singer Lab filter
- Spruston Lab (1) Apply Spruston Lab filter
- Stern Lab (6) Apply Stern Lab filter
- Sternson Lab (5) Apply Sternson Lab filter
- Stringer Lab (1) Apply Stringer Lab filter
- Svoboda Lab (7) Apply Svoboda Lab filter
- Tebo Lab (2) Apply Tebo Lab filter
- Tervo Lab (1) Apply Tervo Lab filter
- Tillberg Lab (1) Apply Tillberg Lab filter
- Tjian Lab (4) Apply Tjian Lab filter
- Truman Lab (1) Apply Truman Lab filter
- Turaga Lab (1) Apply Turaga Lab filter
- Turner Lab (1) Apply Turner Lab filter
- Wang (Shaohe) Lab (1) Apply Wang (Shaohe) Lab filter
- Wu Lab (2) Apply Wu Lab filter
- Zlatic Lab (1) Apply Zlatic Lab filter
- Zuker Lab (1) Apply Zuker Lab filter
Associated Project Team
Publication Date
- December 2014 (35) Apply December 2014 filter
- November 2014 (14) Apply November 2014 filter
- October 2014 (15) Apply October 2014 filter
- September 2014 (17) Apply September 2014 filter
- August 2014 (14) Apply August 2014 filter
- July 2014 (26) Apply July 2014 filter
- June 2014 (14) Apply June 2014 filter
- May 2014 (14) Apply May 2014 filter
- April 2014 (20) Apply April 2014 filter
- March 2014 (18) Apply March 2014 filter
- February 2014 (15) Apply February 2014 filter
- January 2014 (34) Apply January 2014 filter
- Remove 2014 filter 2014
Type of Publication
236 Publications
Showing 1-10 of 236 results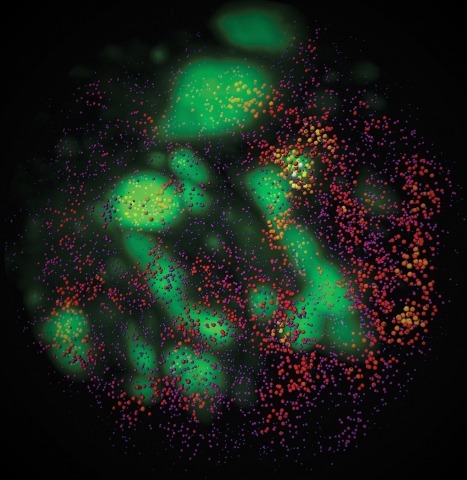
Combinatorial cis-regulatory networks encoded in animal genomes represent the foundational gene expression mechanism for directing cell-fate commitment and maintenance of cell identity by transcription factors (TFs). However, the 3D spatial organization of cis-elements and how such sub-nuclear structures influence TF activity remain poorly understood. Here, we combine lattice light-sheet imaging, single-molecule tracking, numerical simulations, and ChIP-exo mapping to localize and functionally probe Sox2 enhancer-organization in living embryonic stem cells. Sox2 enhancers form 3D-clusters that are segregated from heterochromatin but overlap with a subset of Pol II enriched regions. Sox2 searches for specific binding targets via a 3D-diffusion dominant mode when shuttling long-distances between clusters while chromatin-bound states predominate within individual clusters. Thus, enhancer clustering may reduce global search efficiency but enables rapid local fine-tuning of TF search parameters. Our results suggest an integrated model linking cis-element 3D spatial distribution to local-versus-global target search modalities essential for regulating eukaryotic gene transcription.
3D live imaging is important for a better understanding of biological processes, but it is challenging with current techniques such as spinning-disk confocal microscopy. Bessel beam plane illumination microscopy allows high-speed 3D live fluorescence imaging of living cellular and multicellular specimens with nearly isotropic spatial resolution, low photobleaching and low photodamage. Unlike conventional fluorescence imaging techniques that usually have a unique operation mode, Bessel plane illumination has several modes that offer different performance with different imaging metrics. To achieve optimal results from this technique, the appropriate operation mode needs to be selected and the experimental setting must be optimized for the specific application and associated sample properties. Here we explain the fundamental working principles of this technique, discuss the pros and cons of each operational mode and show through examples how to optimize experimental parameters. We also describe the procedures needed to construct, align and operate a Bessel beam plane illumination microscope by using our previously reported system as an example, and we list the necessary equipment to build such a microscope. Assuming all components are readily available, it would take a person skilled in optical instrumentation \~{}1 month to assemble and operate a microscope according to this protocol.
This paper proposes a novel agglomerative framework for Electron Microscopy (EM) image (or volume) segmentation. For the overall segmentation methodology, we propose a context-aware algorithm that clusters the over-segmented regions of different sub-classes (representing different biological entities) in different stages. Furthermore, a delayed scheme for agglomerative clustering, which postpones the merge of newly formed bodies, is also proposed to generate a more confident boundary prediction. We report significant improvements in both segmentation accuracy and speed attained by the proposed approaches over existing standard methods on both 2D and 3D datasets.
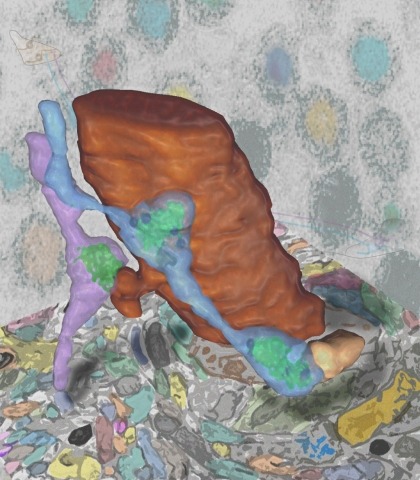
How adherent and contractile systems coordinate to promote cell shape changes is unclear. Here, we define a counterbalanced adhesion/contraction model for cell shape control. Live-cell microscopy data showed a crucial role for a contractile meshwork at the top of the cell, which is composed of actin arcs and myosin IIA filaments. The contractile actin meshwork is organized like muscle sarcomeres, with repeating myosin II filaments separated by the actin bundling protein α-actinin, and is mechanically coupled to noncontractile dorsal actin fibers that run from top to bottom in the cell. When the meshwork contracts, it pulls the dorsal fibers away from the substrate. This pulling force is counterbalanced by the dorsal fibers' attachment to focal adhesions, causing the fibers to bend downward and flattening the cell. This model is likely to be relevant for understanding how cells configure themselves to complex surfaces, protrude into tight spaces, and generate three-dimensional forces on the growth substrate under both healthy and diseased conditions.
How adherent and contractile systems coordinate to promote cell shape changes is unclear. Here, we define a counterbalanced adhesion/contraction model for cell shape control. Live-cell microscopy data showed a crucial role for a contractile meshwork at the top of the cell, which is composed of actin arcs and myosin IIA filaments. The contractile actin meshwork is organized like muscle sarcomeres, with repeating myosin II filaments separated by the actin bundling protein α-actinin, and is mechanically coupled to noncontractile dorsal actin fibers that run from top to bottom in the cell. When the meshwork contracts, it pulls the dorsal fibers away from the substrate. This pulling force is counterbalanced by the dorsal fibers' attachment to focal adhesions, causing the fibers to bend downward and flattening the cell. This model is likely to be relevant for understanding how cells configure themselves to complex surfaces, protrude into tight spaces, and generate three-dimensional forces on the growth substrate under both healthy and diseased conditions.
Ion channels are among the most important proteins in biology, regulating the activity of excitable cells and changing in diseases. Ideally it would be possible to actuate endogenous ion channels, in a temporally precise and reversible manner, and without requiring chemical cofactors. Here we present a modular protein architecture for fully genetically encoded, light-modulated control of ligands that modulate ion channels of a targeted cell. Our reagent, which we call a lumitoxin, combines a photoswitch and an ion channel-blocking peptide toxin. Illumination causes the photoswitch to unfold, lowering the toxin’s local concentration near the cell surface, and enabling the ion channel to function. We explore lumitoxin modularity by showing operation with peptide toxins that target different voltage-dependent K+ channels. The lumitoxin architecture may represent a new kind of modular protein-engineering strategy for designing light-activated proteins, and thus may enable development of novel tools for modulating cellular physiology.
We report the larval CNS expression patterns for 6,650 GAL4 lines based on cis-regulatory regions (CRMs) from the Drosophila genome. Adult CNS expression patterns were previously reported for this collection, thereby providing a unique resource for determining the origins of adult cells. An illustrative example reveals the origin of the astrocyte-like glia of the ventral CNS. Besides larval neurons and glia, the larval CNS contains scattered lineages of immature, adult-specific neurons. Comparison of lineage expression within this large collection of CRMs provides insight into the codes used for designating neuronal types. The CRMs encode both dense and sparse patterns of lineage expression. There is little correlation between brain and thoracic lineages in patterns of sparse expression, but expression in the two regions is highly correlated in the dense mode. The optic lobes, by comparison, appear to use a different set of genetic instructions in their development.
Synaptic connectivity and molecular composition provide a blueprint for information processing in neural circuits. Detailed structural analysis of neural circuits requires nanometer resolution, which can be obtained with serial-section electron microscopy. However, this technique remains challenging for reconstructing molecularly defined synapses. We used a genetically encoded synaptic marker for electron microscopy (GESEM) based on intra-vesicular generation of electron-dense labeling in axonal boutons. This approach allowed the identification of synapses from Cre recombinase-expressing or GAL4-expressing neurons in the mouse and fly with excellent preservation of ultrastructure. We applied this tool to visualize long-range connectivity of AGRP and POMC neurons in the mouse, two molecularly defined hypothalamic populations that are important for feeding behavior. Combining selective ultrastructural reconstruction of neuropil with functional and viral circuit mapping, we characterized some basic features of circuit organization for axon projections of these cell types. Our findings demonstrate that GESEM labeling enables long-range connectomics with molecularly defined cell types.
To provide a temporal framework for the genoarchitecture of brain development, we generated in situ hybridization data for embryonic and postnatal mouse brain at seven developmental stages for ∼2,100 genes, which were processed with an automated informatics pipeline and manually annotated. This resource comprises 434,946 images, seven reference atlases, an ontogenetic ontology, and tools to explore coexpression of genes across neurodevelopment. Gene sets coinciding with developmental phenomena were identified. A temporal shift in the principles governing the molecular organization of the brain was detected, with transient neuromeric, plate-based organization of the brain present at E11.5 and E13.5. Finally, these data provided a transcription factor code that discriminates brain structures and identifies the developmental age of a tissue, providing a foundation for eventual genetic manipulation or tracking of specific brain structures over development. The resource is available as the Allen Developing Mouse Brain Atlas (http://developingmouse.brain-map.org).