
Filter
Associated Lab
- Aguilera Castrejon Lab (1) Apply Aguilera Castrejon Lab filter
- Ahrens Lab (53) Apply Ahrens Lab filter
- Aso Lab (40) Apply Aso Lab filter
- Baker Lab (19) Apply Baker Lab filter
- Betzig Lab (101) Apply Betzig Lab filter
- Beyene Lab (8) Apply Beyene Lab filter
- Bock Lab (14) Apply Bock Lab filter
- Branson Lab (50) Apply Branson Lab filter
- Card Lab (36) Apply Card Lab filter
- Cardona Lab (45) Apply Cardona Lab filter
- Chklovskii Lab (10) Apply Chklovskii Lab filter
- Clapham Lab (14) Apply Clapham Lab filter
- Cui Lab (19) Apply Cui Lab filter
- Darshan Lab (8) Apply Darshan Lab filter
- Dickson Lab (32) Apply Dickson Lab filter
- Druckmann Lab (21) Apply Druckmann Lab filter
- Dudman Lab (38) Apply Dudman Lab filter
- Eddy/Rivas Lab (30) Apply Eddy/Rivas Lab filter
- Egnor Lab (4) Apply Egnor Lab filter
- Espinosa Medina Lab (15) Apply Espinosa Medina Lab filter
- Feliciano Lab (7) Apply Feliciano Lab filter
- Fetter Lab (31) Apply Fetter Lab filter
- Fitzgerald Lab (16) Apply Fitzgerald Lab filter
- Freeman Lab (15) Apply Freeman Lab filter
- Funke Lab (38) Apply Funke Lab filter
- Gonen Lab (59) Apply Gonen Lab filter
- Grigorieff Lab (34) Apply Grigorieff Lab filter
- Harris Lab (53) Apply Harris Lab filter
- Heberlein Lab (13) Apply Heberlein Lab filter
- Hermundstad Lab (23) Apply Hermundstad Lab filter
- Hess Lab (74) Apply Hess Lab filter
- Ilanges Lab (2) Apply Ilanges Lab filter
- Jayaraman Lab (42) Apply Jayaraman Lab filter
- Ji Lab (33) Apply Ji Lab filter
- Johnson Lab (1) Apply Johnson Lab filter
- Karpova Lab (13) Apply Karpova Lab filter
- Keleman Lab (8) Apply Keleman Lab filter
- Keller Lab (61) Apply Keller Lab filter
- Koay Lab (2) Apply Koay Lab filter
- Lavis Lab (137) Apply Lavis Lab filter
- Lee (Albert) Lab (29) Apply Lee (Albert) Lab filter
- Leonardo Lab (19) Apply Leonardo Lab filter
- Li Lab (4) Apply Li Lab filter
- Lippincott-Schwartz Lab (97) Apply Lippincott-Schwartz Lab filter
- Liu (Yin) Lab (1) Apply Liu (Yin) Lab filter
- Liu (Zhe) Lab (58) Apply Liu (Zhe) Lab filter
- Looger Lab (137) Apply Looger Lab filter
- Magee Lab (31) Apply Magee Lab filter
- Menon Lab (12) Apply Menon Lab filter
- Murphy Lab (6) Apply Murphy Lab filter
- O'Shea Lab (6) Apply O'Shea Lab filter
- Otopalik Lab (1) Apply Otopalik Lab filter
- Pachitariu Lab (36) Apply Pachitariu Lab filter
- Pastalkova Lab (5) Apply Pastalkova Lab filter
- Pavlopoulos Lab (7) Apply Pavlopoulos Lab filter
- Pedram Lab (4) Apply Pedram Lab filter
- Podgorski Lab (16) Apply Podgorski Lab filter
- Reiser Lab (45) Apply Reiser Lab filter
- Riddiford Lab (20) Apply Riddiford Lab filter
- Romani Lab (31) Apply Romani Lab filter
- Rubin Lab (105) Apply Rubin Lab filter
- Saalfeld Lab (46) Apply Saalfeld Lab filter
- Satou Lab (1) Apply Satou Lab filter
- Scheffer Lab (36) Apply Scheffer Lab filter
- Schreiter Lab (50) Apply Schreiter Lab filter
- Sgro Lab (1) Apply Sgro Lab filter
- Shroff Lab (31) Apply Shroff Lab filter
- Simpson Lab (18) Apply Simpson Lab filter
- Singer Lab (37) Apply Singer Lab filter
- Spruston Lab (57) Apply Spruston Lab filter
- Stern Lab (73) Apply Stern Lab filter
- Sternson Lab (47) Apply Sternson Lab filter
- Stringer Lab (32) Apply Stringer Lab filter
- Svoboda Lab (131) Apply Svoboda Lab filter
- Tebo Lab (9) Apply Tebo Lab filter
- Tervo Lab (9) Apply Tervo Lab filter
- Tillberg Lab (18) Apply Tillberg Lab filter
- Tjian Lab (17) Apply Tjian Lab filter
- Truman Lab (58) Apply Truman Lab filter
- Turaga Lab (39) Apply Turaga Lab filter
- Turner Lab (27) Apply Turner Lab filter
- Vale Lab (7) Apply Vale Lab filter
- Voigts Lab (3) Apply Voigts Lab filter
- Wang (Meng) Lab (21) Apply Wang (Meng) Lab filter
- Wang (Shaohe) Lab (6) Apply Wang (Shaohe) Lab filter
- Wu Lab (8) Apply Wu Lab filter
- Zlatic Lab (26) Apply Zlatic Lab filter
- Zuker Lab (5) Apply Zuker Lab filter
Associated Project Team
- CellMap (12) Apply CellMap filter
- COSEM (3) Apply COSEM filter
- FIB-SEM Technology (3) Apply FIB-SEM Technology filter
- Fly Descending Interneuron (11) Apply Fly Descending Interneuron filter
- Fly Functional Connectome (14) Apply Fly Functional Connectome filter
- Fly Olympiad (5) Apply Fly Olympiad filter
- FlyEM (53) Apply FlyEM filter
- FlyLight (49) Apply FlyLight filter
- GENIE (46) Apply GENIE filter
- Integrative Imaging (4) Apply Integrative Imaging filter
- Larval Olympiad (2) Apply Larval Olympiad filter
- MouseLight (18) Apply MouseLight filter
- NeuroSeq (1) Apply NeuroSeq filter
- ThalamoSeq (1) Apply ThalamoSeq filter
- Tool Translation Team (T3) (26) Apply Tool Translation Team (T3) filter
- Transcription Imaging (45) Apply Transcription Imaging filter
Publication Date
- 2025 (126) Apply 2025 filter
- 2024 (215) Apply 2024 filter
- 2023 (159) Apply 2023 filter
- 2022 (167) Apply 2022 filter
- 2021 (175) Apply 2021 filter
- 2020 (177) Apply 2020 filter
- 2019 (177) Apply 2019 filter
- 2018 (206) Apply 2018 filter
- 2017 (186) Apply 2017 filter
- 2016 (191) Apply 2016 filter
- 2015 (195) Apply 2015 filter
- 2014 (190) Apply 2014 filter
- 2013 (136) Apply 2013 filter
- 2012 (112) Apply 2012 filter
- 2011 (98) Apply 2011 filter
- 2010 (61) Apply 2010 filter
- 2009 (56) Apply 2009 filter
- 2008 (40) Apply 2008 filter
- 2007 (21) Apply 2007 filter
- 2006 (3) Apply 2006 filter
Type of Publication
- Remove Janelia filter Janelia
2691 Publications
Showing 2051-2060 of 2691 resultsControlling the propagation of electromagnetic waves is important to a broad range of applications. Recent advances in controlling wave propagation in random scattering media have enabled optical focusing and imaging inside random scattering media. In this work, we propose and demonstrate a new method to deliver optical power more efficiently through scattering media. Drastically different from the random matrix characterization approach, our method can rapidly establish high efficiency communication channels using just a few measurements, regardless of the number of optical modes, and provides a practical and robust solution to boost the signal levels in optical or short wave communications. We experimentally demonstrated analog and digital signal transmission through highly scattering media with greatly improved performance. Besides scattering, our method can also reduce the loss of signal due to absorption. Experimentally, we observed that our method forced light to go around absorbers, leading to even higher signal improvement than in the case of purely scattering media. Interestingly, the resulting signal improvement is highly directional, which provides a new means against eavesdropping.

The behavior of individuals determines the strength and outcome of ecological interactions, which drive population, community, and ecosystem organization. Bio-logging, such as telemetry and animal-borne imaging, provides essential individual viewpoints, tracks, and life histories, but requires capture of individuals and is often impractical to scale. Recent developments in automated image-based tracking offers opportunities to remotely quantify and understand individual behavior at scales and resolutions not previously possible, providing an essential supplement to other tracking methodologies in ecology. Automated image-based tracking should continue to advance the field of ecology by enabling better understanding of the linkages between individual and higher-level ecological processes, via high-throughput quantitative analysis of complex ecological patterns and processes across scales, including analysis of environmental drivers.
The mammalian vomeronasal organ encodes pheromone information about gender, reproductive status, genetic background and individual differences. It remains unknown how pheromone information interacts to trigger innate behaviors. In this study, we identify vomeronasal receptors responsible for detecting female pheromones. A sub-group of V1re clade members recognizes gender-identifying cues in female urine. Multiple members of the V1rj clade are cognate receptors for urinary estrus signals, as well as for sulfated estrogen (SE) compounds. In both cases, the same cue activates multiple homologous receptors, suggesting redundancy in encoding female pheromone cues. Neither gender-specific cues nor SEs alone are sufficient to promote courtship behavior in male mice, whereas robust courtship behavior can be induced when the two cues are applied together. Thus, integrated action of different female cues is required in pheromone-triggered mating behavior. These results suggest a gating mechanism in the vomeronasal circuit in promoting specific innate behavior.DOI: http://dx.doi.org/10.7554/eLife.03025.001.
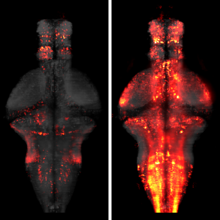
The processing of sensory input and the generation of behavior involves large networks of neurons, which necessitates new technology for recording from many neurons in behaving animals. In the larval zebrafish, light-sheet microscopy can be used to record the activity of almost all neurons in the brain simultaneously at single-cell resolution. Existing implementations, however, cannot be combined with visually driven behavior because the light sheet scans over the eye, interfering with presentation of controlled visual stimuli. Here we describe a system that overcomes the confounding eye stimulation through the use of two light sheets and combines whole-brain light-sheet imaging with virtual reality for fictively behaving larval zebrafish.
Understanding brain function requires monitoring and interpreting the activity of large networks of neurons during behavior. Advances in recording technology are greatly increasing the size and complexity of neural data. Analyzing such data will pose a fundamental bottleneck for neuroscience. We present a library of analytical tools called Thunder built on the open-source Apache Spark platform for large-scale distributed computing. The library implements a variety of univariate and multivariate analyses with a modular, extendable structure well-suited to interactive exploration and analysis development. We demonstrate how these analyses find structure in large-scale neural data, including whole-brain light-sheet imaging data from fictively behaving larval zebrafish, and two-photon imaging data from behaving mouse. The analyses relate neuronal responses to sensory input and behavior, run in minutes or less and can be used on a private cluster or in the cloud. Our open-source framework thus holds promise for turning brain activity mapping efforts into biological insights.
How do evolved genetic changes alter the nervous system to produce different patterns of behavior? We address this question using Drosophila male courtship behavior, which is innate, stereotyped, and evolves rapidly between species. D. melanogaster male courtship requires the male-specific isoforms of two transcription factors, fruitless and doublesex. These genes underlie genetic switches between female and male behaviors, making them excellent candidate genes for courtship behavior evolution. We tested their role in courtship evolution by transferring the entire locus for each gene from divergent species to D. melanogaster. We found that despite differences in Fru+ and Dsx+ cell numbers in wild-type species, cross-species transgenes rescued D. melanogaster courtship behavior and no species-specific behaviors were conferred. Therefore, fru and dsx are not a significant source of evolutionary variation in courtship behavior.
The type II clustered regularly interspaced short palindromic repeats (CRISPR)/CRISPR-associated (Cas) system has emerged recently as a powerful method to manipulate the genomes of various organisms. Here, we report a toolbox for high-efficiency genome engineering of Drosophila melanogaster consisting of transgenic Cas9 lines and versatile guide RNA (gRNA) expression plasmids. Systematic evaluation reveals Cas9 lines with ubiquitous or germ-line-restricted patterns of activity. We also demonstrate differential activity of the same gRNA expressed from different U6 snRNA promoters, with the previously untested U6:3 promoter giving the most potent effect. An appropriate combination of Cas9 and gRNA allows targeting of essential and nonessential genes with transmission rates ranging from 25-100%. We also demonstrate that our optimized CRISPR/Cas tools can be used for offset nicking-based mutagenesis. Furthermore, in combination with oligonucleotide or long double-stranded donor templates, our reagents allow precise genome editing by homology-directed repair with rates that make selection markers unnecessary. Last, we demonstrate a novel application of CRISPR/Cas-mediated technology in revealing loss-of-function phenotypes in somatic cells following efficient biallelic targeting by Cas9 expressed in a ubiquitous or tissue-restricted manner. Our CRISPR/Cas tools will facilitate the rapid evaluation of mutant phenotypes of specific genes and the precise modification of the genome with single-nucleotide precision. Our results also pave the way for high-throughput genetic screening with CRISPR/Cas.
BACKGROUND: Female sexual receptivity offers an excellent model for complex behavioral decisions. The female must parse her own reproductive state, the external environment, and male sensory cues to decide whether to copulate. In the fly Drosophila melanogaster, virgin female receptivity has received relatively little attention, and its neural circuitry and individual behavioral components remain unmapped. Using a genome-wide neuronal RNAi screen, we identify a subpopulation of neurons responsible for pausing, a novel behavioral aspect of virgin female receptivity characterized in this study. RESULTS: We show that Abdominal-B (Abd-B), a homeobox transcription factor, is required in developing neurons for high levels of virgin female receptivity. Silencing adult Abd-B neurons significantly decreased receptivity. We characterize two components of receptivity that are elicited in sexually mature females by male courtship: pausing and vaginal plate opening. Silencing Abd-B neurons decreased pausing but did not affect vaginal plate opening, demonstrating that these two components of female sexual behavior are functionally separable. Synthetic activation of Abd-B neurons increased pausing, but male courtship song alone was not sufficient to elicit this behavior. CONCLUSIONS: Our results provide an entry point to the neural circuit controlling virgin female receptivity. The female integrates multiple sensory cues from the male to execute discrete motor programs prior to copulation. Abd-B neurons control pausing, a key aspect of female sexual receptivity, in response to male courtship.

The comprehensive reconstruction of cell lineages in complex multicellular organisms is a central goal of developmental biology. We present an open-source computational framework for the segmentation and tracking of cell nuclei with high accuracy and speed. We demonstrate its (i) generality by reconstructing cell lineages in four-dimensional, terabyte-sized image data sets of fruit fly, zebrafish and mouse embryos acquired with three types of fluorescence microscopes, (ii) scalability by analyzing advanced stages of development with up to 20,000 cells per time point at 26,000 cells min(-1) on a single computer workstation and (iii) ease of use by adjusting only two parameters across all data sets and providing visualization and editing tools for efficient data curation. Our approach achieves on average 97.0% linkage accuracy across all species and imaging modalities. Using our system, we performed the first cell lineage reconstruction of early Drosophila melanogaster nervous system development, revealing neuroblast dynamics throughout an entire embryo.