Filter
Associated Lab
- Aguilera Castrejon Lab (16) Apply Aguilera Castrejon Lab filter
- Ahrens Lab (64) Apply Ahrens Lab filter
- Aso Lab (40) Apply Aso Lab filter
- Baker Lab (38) Apply Baker Lab filter
- Betzig Lab (113) Apply Betzig Lab filter
- Beyene Lab (13) Apply Beyene Lab filter
- Bock Lab (17) Apply Bock Lab filter
- Branson Lab (53) Apply Branson Lab filter
- Card Lab (42) Apply Card Lab filter
- Cardona Lab (64) Apply Cardona Lab filter
- Chklovskii Lab (13) Apply Chklovskii Lab filter
- Clapham Lab (15) Apply Clapham Lab filter
- Cui Lab (19) Apply Cui Lab filter
- Darshan Lab (12) Apply Darshan Lab filter
- Dennis Lab (1) Apply Dennis Lab filter
- Dickson Lab (46) Apply Dickson Lab filter
- Druckmann Lab (25) Apply Druckmann Lab filter
- Dudman Lab (50) Apply Dudman Lab filter
- Eddy/Rivas Lab (30) Apply Eddy/Rivas Lab filter
- Egnor Lab (11) Apply Egnor Lab filter
- Espinosa Medina Lab (19) Apply Espinosa Medina Lab filter
- Feliciano Lab (7) Apply Feliciano Lab filter
- Fetter Lab (41) Apply Fetter Lab filter
- Fitzgerald Lab (29) Apply Fitzgerald Lab filter
- Freeman Lab (15) Apply Freeman Lab filter
- Funke Lab (38) Apply Funke Lab filter
- Gonen Lab (91) Apply Gonen Lab filter
- Grigorieff Lab (62) Apply Grigorieff Lab filter
- Harris Lab (63) Apply Harris Lab filter
- Heberlein Lab (94) Apply Heberlein Lab filter
- Hermundstad Lab (27) Apply Hermundstad Lab filter
- Hess Lab (77) Apply Hess Lab filter
- Ilanges Lab (2) Apply Ilanges Lab filter
- Jayaraman Lab (46) Apply Jayaraman Lab filter
- Ji Lab (33) Apply Ji Lab filter
- Johnson Lab (6) Apply Johnson Lab filter
- Kainmueller Lab (19) Apply Kainmueller Lab filter
- Karpova Lab (14) Apply Karpova Lab filter
- Keleman Lab (13) Apply Keleman Lab filter
- Keller Lab (76) Apply Keller Lab filter
- Koay Lab (18) Apply Koay Lab filter
- Lavis Lab (149) Apply Lavis Lab filter
- Lee (Albert) Lab (34) Apply Lee (Albert) Lab filter
- Leonardo Lab (23) Apply Leonardo Lab filter
- Li Lab (28) Apply Li Lab filter
- Lippincott-Schwartz Lab (169) Apply Lippincott-Schwartz Lab filter
- Liu (Yin) Lab (6) Apply Liu (Yin) Lab filter
- Liu (Zhe) Lab (63) Apply Liu (Zhe) Lab filter
- Looger Lab (138) Apply Looger Lab filter
- Magee Lab (49) Apply Magee Lab filter
- Menon Lab (18) Apply Menon Lab filter
- Murphy Lab (13) Apply Murphy Lab filter
- O'Shea Lab (7) Apply O'Shea Lab filter
- Otopalik Lab (13) Apply Otopalik Lab filter
- Pachitariu Lab (48) Apply Pachitariu Lab filter
- Pastalkova Lab (18) Apply Pastalkova Lab filter
- Pavlopoulos Lab (19) Apply Pavlopoulos Lab filter
- Pedram Lab (15) Apply Pedram Lab filter
- Podgorski Lab (16) Apply Podgorski Lab filter
- Reiser Lab (51) Apply Reiser Lab filter
- Riddiford Lab (44) Apply Riddiford Lab filter
- Romani Lab (43) Apply Romani Lab filter
- Rubin Lab (143) Apply Rubin Lab filter
- Saalfeld Lab (63) Apply Saalfeld Lab filter
- Satou Lab (16) Apply Satou Lab filter
- Scheffer Lab (36) Apply Scheffer Lab filter
- Schreiter Lab (67) Apply Schreiter Lab filter
- Sgro Lab (21) Apply Sgro Lab filter
- Shroff Lab (31) Apply Shroff Lab filter
- Simpson Lab (23) Apply Simpson Lab filter
- Singer Lab (80) Apply Singer Lab filter
- Spruston Lab (93) Apply Spruston Lab filter
- Stern Lab (156) Apply Stern Lab filter
- Sternson Lab (54) Apply Sternson Lab filter
- Stringer Lab (35) Apply Stringer Lab filter
- Svoboda Lab (135) Apply Svoboda Lab filter
- Tebo Lab (33) Apply Tebo Lab filter
- Tervo Lab (9) Apply Tervo Lab filter
- Tillberg Lab (21) Apply Tillberg Lab filter
- Tjian Lab (64) Apply Tjian Lab filter
- Truman Lab (88) Apply Truman Lab filter
- Turaga Lab (51) Apply Turaga Lab filter
- Turner Lab (38) Apply Turner Lab filter
- Vale Lab (7) Apply Vale Lab filter
- Voigts Lab (3) Apply Voigts Lab filter
- Wang (Meng) Lab (21) Apply Wang (Meng) Lab filter
- Wang (Shaohe) Lab (25) Apply Wang (Shaohe) Lab filter
- Wu Lab (9) Apply Wu Lab filter
- Zlatic Lab (28) Apply Zlatic Lab filter
- Zuker Lab (25) Apply Zuker Lab filter
Associated Project Team
- CellMap (12) Apply CellMap filter
- COSEM (3) Apply COSEM filter
- FIB-SEM Technology (3) Apply FIB-SEM Technology filter
- Fly Descending Interneuron (11) Apply Fly Descending Interneuron filter
- Fly Functional Connectome (14) Apply Fly Functional Connectome filter
- Fly Olympiad (5) Apply Fly Olympiad filter
- FlyEM (53) Apply FlyEM filter
- FlyLight (49) Apply FlyLight filter
- GENIE (46) Apply GENIE filter
- Integrative Imaging (4) Apply Integrative Imaging filter
- Larval Olympiad (2) Apply Larval Olympiad filter
- MouseLight (18) Apply MouseLight filter
- NeuroSeq (1) Apply NeuroSeq filter
- ThalamoSeq (1) Apply ThalamoSeq filter
- Tool Translation Team (T3) (26) Apply Tool Translation Team (T3) filter
- Transcription Imaging (49) Apply Transcription Imaging filter
Publication Date
- 2025 (126) Apply 2025 filter
- 2024 (216) Apply 2024 filter
- 2023 (160) Apply 2023 filter
- 2022 (193) Apply 2022 filter
- 2021 (194) Apply 2021 filter
- 2020 (196) Apply 2020 filter
- 2019 (202) Apply 2019 filter
- 2018 (232) Apply 2018 filter
- 2017 (217) Apply 2017 filter
- 2016 (209) Apply 2016 filter
- 2015 (252) Apply 2015 filter
- 2014 (236) Apply 2014 filter
- 2013 (194) Apply 2013 filter
- 2012 (190) Apply 2012 filter
- 2011 (190) Apply 2011 filter
- 2010 (161) Apply 2010 filter
- 2009 (158) Apply 2009 filter
- 2008 (140) Apply 2008 filter
- 2007 (106) Apply 2007 filter
- 2006 (92) Apply 2006 filter
- 2005 (67) Apply 2005 filter
- 2004 (57) Apply 2004 filter
- 2003 (58) Apply 2003 filter
- 2002 (39) Apply 2002 filter
- 2001 (28) Apply 2001 filter
- 2000 (29) Apply 2000 filter
- 1999 (14) Apply 1999 filter
- 1998 (18) Apply 1998 filter
- 1997 (16) Apply 1997 filter
- 1996 (10) Apply 1996 filter
- 1995 (18) Apply 1995 filter
- 1994 (12) Apply 1994 filter
- 1993 (10) Apply 1993 filter
- 1992 (6) Apply 1992 filter
- 1991 (11) Apply 1991 filter
- 1990 (11) Apply 1990 filter
- 1989 (6) Apply 1989 filter
- 1988 (1) Apply 1988 filter
- 1987 (7) Apply 1987 filter
- 1986 (4) Apply 1986 filter
- 1985 (5) Apply 1985 filter
- 1984 (2) Apply 1984 filter
- 1983 (2) Apply 1983 filter
- 1982 (3) Apply 1982 filter
- 1981 (3) Apply 1981 filter
- 1980 (1) Apply 1980 filter
- 1979 (1) Apply 1979 filter
- 1976 (2) Apply 1976 filter
- 1973 (1) Apply 1973 filter
- 1970 (1) Apply 1970 filter
- 1967 (1) Apply 1967 filter
Type of Publication
4108 Publications
Showing 3511-3520 of 4108 resultsAlterations in Hox gene expression patterns have been implicated in both large and small-scale morphological evolution. An improved understanding of these changes requires a detailed understanding of Hox gene cis-regulatory function and evolution. cis-regulatory evolution of the Hox gene Ultrabithorax (Ubx) has been shown to contribute to evolution of trichome patterns on the posterior second femur (T2p) of Drosophila species. As a step toward determining how this function of Ubx has evolved, we performed a series of experiments to clarify the role of Ubx in patterning femurs and to identify the cis-regulatory regions of Ubx that drive expression in T2p. We first performed clonal analysis to further define Ubx function in patterning bristle and trichome patterns in the legs. We found that low levels of Ubx expression are sufficient to repress an eighth bristle row on the posterior second and third femurs, whereas higher levels of expression are required to promote the development and migration of other bristles on the third femur and to repress trichomes. We then tested the hypothesis that the evolutionary difference in T2p trichome patterns due to Ubx was caused by a change in the global cis-regulation of Ubx expression. We found no evidence to support this view, suggesting that the evolved difference in Ubx function reflects evolution of a leg-specific enhancer. We then searched for the regulatory regions of the Ubx locus that drive expression in the second and third femur by assaying all existing regulatory mutations of the Ubx locus and new deficiencies in the large intron of Ubx that we generated by P-element-induced male recombination. We found that two enhancer regions previously known to regulate Ubx expression in the legs, abx and pbx, are required for Ubx expression in the third femur, but that they do not contribute to pupal expression of Ubx in the second femur. This analysis allowed us to rule out at least 100 kb of DNA in and around the Ubx locus as containing a T2p-specific enhancer. We then surveyed an additional approximately 30 kb using enhancer constructs. None of these enhancer constructs produced an expression pattern similar to Ubx expression in T2p. Thus, after surveying over 95% of the Ubx locus, we have not been able to localize a T2p-specific enhancer. While the enhancer could reside within the small regions we have not surveyed, it is also possible that the enhancer is structurally complex and/or acts only within its native genomic context.
One central, and yet unsolved, question in evolutionary biology is the relationship between the genetic variants segregating within species and the causes of morphological differences between species. The classic neo-darwinian view postulates that species differences result from the accumulation of small-effect changes at multiple loci. However, many examples support the possible role of larger abrupt changes in the expression of developmental genes in morphological evolution. Although this evidence might be considered a challenge to a neo-darwinian micromutationist view of evolution, there are currently few examples of the actual genes causing morphological differences between species. Here we examine the genetic basis of a trichome pattern difference between Drosophila species, previously shown to result from the evolution of a single gene, shavenbaby (svb), probably through cis-regulatory changes. We first identified three distinct svb enhancers from D. melanogaster driving reporter gene expression in partly overlapping patterns that together recapitulate endogenous svb expression. All three homologous enhancers from D. sechellia drive expression in modified patterns, in a direction consistent with the evolved svb expression pattern. To test the influence of these enhancers on the actual phenotypic difference, we conducted interspecific genetic mapping at a resolution sufficient to recover multiple intragenic recombinants. This functional analysis revealed that independent genetic regions upstream of svb that overlap the three identified enhancers are collectively required to generate the D. sechellia trichome pattern. Our results demonstrate that the accumulation of multiple small-effect changes at a single locus underlies the evolution of a morphological difference between species. These data support the view that alleles of large effect that distinguish species may sometimes reflect the accumulation of multiple mutations of small effect at select genes.
We have analyzed brain structure in Macrostomum lignano, a representative of the basal platyhelminth taxon Macrostomida. Using confocal microscopy and digital 3D modeling software on specimens labeled with general markers for neurons (tyrTub), muscles (phalloidin), and nuclei (Sytox), an atlas and digital model of the juvenile Macrostomum brain was generated. The brain forms a ganglion with a central neuropile surrounded by a cortex of neuronal cell bodies. The neuropile contains a stereotypical array of compact axon bundles, as well as branched terminal axons and dendrites. Muscle fibers penetrate the flatworm brain horizontally and vertically at invariant positions. Beside the invariant pattern of neurite bundles, these "cerebral muscles" represent a convenient system of landmarks that help define discrete compartments in the juvenile brain. Commissural axon bundles define a dorsal and ventro-medial neuropile compartment, respectively. Longitudinal axons that enter the neuropile through an invariant set of anterior and posterior nerve roots define a ventro-basal and a central medial compartment in the neuropile. Flanking these "fibrous" compartments are neuropile domains that lack thick axon bundles and are composed of short collaterals and terminal arborizations of neurites. Two populations of neurons, visualized by antibodies against FMRFamide and serotonin, respectively, were mapped relative to compartment boundaries. This study will aid in the documentation and interpretation of patterns of gene expression, as well as functional studies, in the developing Macrostomum brain.
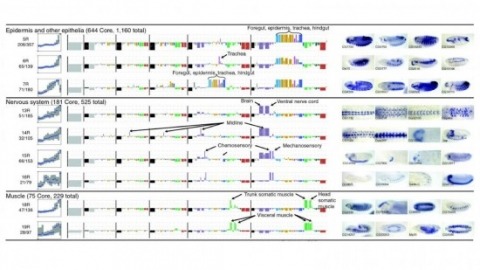
Cell and tissue specific gene expression is a defining feature of embryonic development in multi-cellular organisms. However, the range of gene expression patterns, the extent of the correlation of expression with function, and the classes of genes whose spatial expression are tightly regulated have been unclear due to the lack of an unbiased, genome-wide survey of gene expression patterns.
BACKGROUND: Precise connections of neural circuits can be specified by genetic programming. In the Drosophila olfactory system, projection neurons (PNs) send dendrites to single glomeruli in the antenna lobe (AL) based upon lineage and birth order and send axons with stereotyped terminations to higher olfactory centers. These decisions are likely specified by a PN-intrinsic transcriptional code that regulates the expression of cell-surface molecules to instruct wiring specificity. RESULTS: We find that the loss of longitudinals lacking (lola), which encodes a BTB-Zn-finger transcription factor with 20 predicted splice isoforms, results in wiring defects in both axons and dendrites of all lineages of PNs. RNA in situ hybridization and quantitative RT-PCR suggest that most if not all lola isoforms are expressed in all PNs, but different isoforms are expressed at widely varying levels. Overexpression of individual lola isoforms fails to rescue the lola null phenotypes and causes additional phenotypes. Loss of lola also results in ectopic expression of Gal4 drivers in multiple cell types and in the loss of transcription factor gene lim1 expression in ventral PNs. CONCLUSION: Our results indicate that lola is required for wiring of axons and dendrites of most PN classes, and suggest a need for its molecular diversity. Expression pattern changes of Gal4 drivers in lola-/- clones imply that lola normally represses the expression of these regulatory elements in a subset of the cells surrounding the AL. We propose that Lola functions as a general transcription factor that regulates the expression of multiple genes ultimately controlling PN identity and wiring specificity.
Forward genetic screens in model organisms have provided important insights into numerous aspects of development, physiology and pathology. With the availability of complete genome sequences and the introduction of RNA-mediated gene interference (RNAi), systematic reverse genetic screens are now also possible. Until now, such genome-wide RNAi screens have mostly been restricted to cultured cells and ubiquitous gene inactivation in Caenorhabditis elegans. This powerful approach has not yet been applied in a tissue-specific manner. Here we report the generation and validation of a genome-wide library of Drosophila melanogaster RNAi transgenes, enabling the conditional inactivation of gene function in specific tissues of the intact organism. Our RNAi transgenes consist of short gene fragments cloned as inverted repeats and expressed using the binary GAL4/UAS system. We generated 22,270 transgenic lines, covering 88% of the predicted protein-coding genes in the Drosophila genome. Molecular and phenotypic assays indicate that the majority of these transgenes are functional. Our transgenic RNAi library thus opens up the prospect of systematically analysing gene functions in any tissue and at any stage of the Drosophila lifespan.
Staining the mRNA of a gene via in situ hybridization (ISH) during the development of a D. melanogaster embryo delivers the detailed spatio-temporal pattern of expression of the gene. Many biological problems such as the detection of co-expressed genes, co-regulated genes, and transcription factor binding motifs rely heavily on the analyses of these image patterns. The increasing availability of ISH image data motivates the development of automated computational approaches to the analysis of gene expression patterns.
The distribution of chromatin-associated proteins plays a key role in directing nuclear function. Previously, we developed an image-based method to quantify the nuclear distributions of proteins and showed that these distributions depended on the phenotype of human mammary epithelial cells. Here we describe a method that creates a hierarchical tree of the given cell phenotypes and calculates the statistical significance between them, based on the clustering analysis of nuclear protein distributions.
Cortical maps, consisting of orderly arrangements of functional columns, are a hallmark of the organization of the cerebral cortex. However, the microorganization of cortical maps at the level of single neurons is not known, mainly because of the limitations of available mapping techniques. Here, we used bulk loading of Ca(2+) indicators combined with two-photon microscopy to image the activity of multiple single neurons in layer (L) 2/3 of the mouse barrel cortex in vivo. We developed methods that reliably detect single action potentials in approximately half of the imaged neurons in L2/3. This allowed us to measure the spiking probability following whisker deflection and thus map the whisker selectivity for multiple neurons with known spatial relationships. At the level of neuronal populations, the whisker map varied smoothly across the surface of the cortex, within and between the barrels. However, the whisker selectivity of individual neurons recorded simultaneously differed greatly, even for nearest neighbors. Trial-to-trial correlations between pairs of neurons were high over distances spanning multiple cortical columns. Our data suggest that the response properties of individual neurons are shaped by highly specific subcolumnar circuits and the momentary intrinsic state of the neocortex.