Drosophila researchers have known for more than 30 years how to determine and, to some extent, manipulate the DNA sequences—called promoters and enhancers—that control the temporal and spatial expression of individual genes. We used our knowledge of high-throughput molecular and genetic methods to define the sequences controlling the neuronal expression patterns of about 1,100 genes. We selected these genes because their predicted function, as well as existing data on their expression, suggests that they are expressed in some, but not all, cells in the nervous system. We directly analyzed the expression patterns produced by fragments of the control sequences of these genes by generating and analyzing more than 7,000 lines of transgenic animals, using the assay shown in the diagram below.

The methods and results described in this section are reported in Pfeiffer et al. 2008 and Jenett et al. 2012 where more details can be found. Our approach is based on generating lines in which the expression of GAL4 is driven by a defined DNA fragment that contains one or more enhancers. The pipeline we are using to produce the lines is shown in the first diagram and an example of the analysis as applied to the octopamine receptor 2 gene is shown second.

Pipeline for Generation 1 GAL4 driver production and imaging. (1) We selected approximately 1200 genes for which available expression data or predicted function implies expression in a subset of cells in the adult brain: for example, genes encoding transcription factors, neuropeptides, cell surface proteins, ion channels, transporters, and receptors. We spanned the flanking upstream and downstream intergenic regions of these genes, as well as any of their introns larger than 300 bp, with fragments of DNA that averaged 3 kb in length and overlapped (in regions that could not be covered by a single fragment) by about 1 kb. (2) We generated 7,800 fragments by PCR from genomic DNA which were then cloned, sequence verified and inserted upstream of a core promoter and the GAL4 coding region. In about 200 cases where the upstream intergenic region was small, we generated PCR fragments that also contained the start site of transcription and used them to create transcriptional fusion constructs. (3) Constructs were inserted into the attP2 integration site using the phiC31 site-specific integration system and homozygous stocks generated. (4) GAL4 driver lines were crossed to a UAS-GFP reporter, adult brains and ventral nerve cords (VNCs) were imaged by confocal microscopy by the FlyLight project team. (5) the expression patters were annotated. (6) Lines with either no expression (about 17%) or too broad expression (about 30%) were not analyzed further, although many of these lines show highly specific patterns in other tissues.
We also generated nearly 1,500 lines in which the transcription factor LexA, rather than GAL4, is expressed using a selected subset of these enhancer fragments; such lines facilitate experiments where two different expression patterns need to be driven in the same brain. Lines have been deposited in the Bloomington Stock Center. A database showing the expression patterns of the lines and our annotations is available here.

Distinct expression patterns generated by fragments of the octopamine receptor 2 gene. (Top) Diagram of the genomic locus showing the structures of the transcription unit and the position of the fragments that were assayed for enhancer activity. (Bottom) Expression driven by the indicated five fragments in the adult brain and ventral nerve cord is shown in green and the neuropil is counterstained in magenta.
Our analysis of the patterns observed from 6,650 lines (Jenett et al. 2012) indicates that it should be possible to establish a collection of transgenic Drosophila lines, each directing expression to a small subset of cells in the adult brain, and which in sum cover all cells in the brain. We judged that just over half of the lines had a density of labeling—as well as intense, crisp expression patterns—that would make them useful for future anatomical and behavioral experiments. These ranged from expression in ~20 (0.02%) to 5,000 (3%) neurons. A selection of images of some of the sparser lines from this collection can be seen here. We recognize that the preferred cell number for behavioral studies is not known and will certainly depend on the particular behavior and assay; however, we expect that our lines and the experimental approaches they enable will provide the versatility needed to generate expression patterns of the desired sizes. We believe that many experiments will benefit much sparser expression, perhaps even cell type specific expression. To achieve that goal, we are using intersectional methods as described below.
Barret Pfeiffer, Chris Murphy, Heather Dionne were the lead individuals in constructing the lines, working with Genetic Systems, Inc. and the Fly Facility. Teri Ngo worked closely with the FlyLight histology team to generate the confocal images. Arnim Jenett led the annotation effort. As part of the Janelia visitor program, Malte Kremer and Ulrike Gaul analyzed the lines for glial expression.
In addition to the adult brain and ventral nerve cord, the lines are being imaged in the third instar larval nervous system by the FlyLight project team and the expression patterns are being analyzed by a team led by Jim Truman.
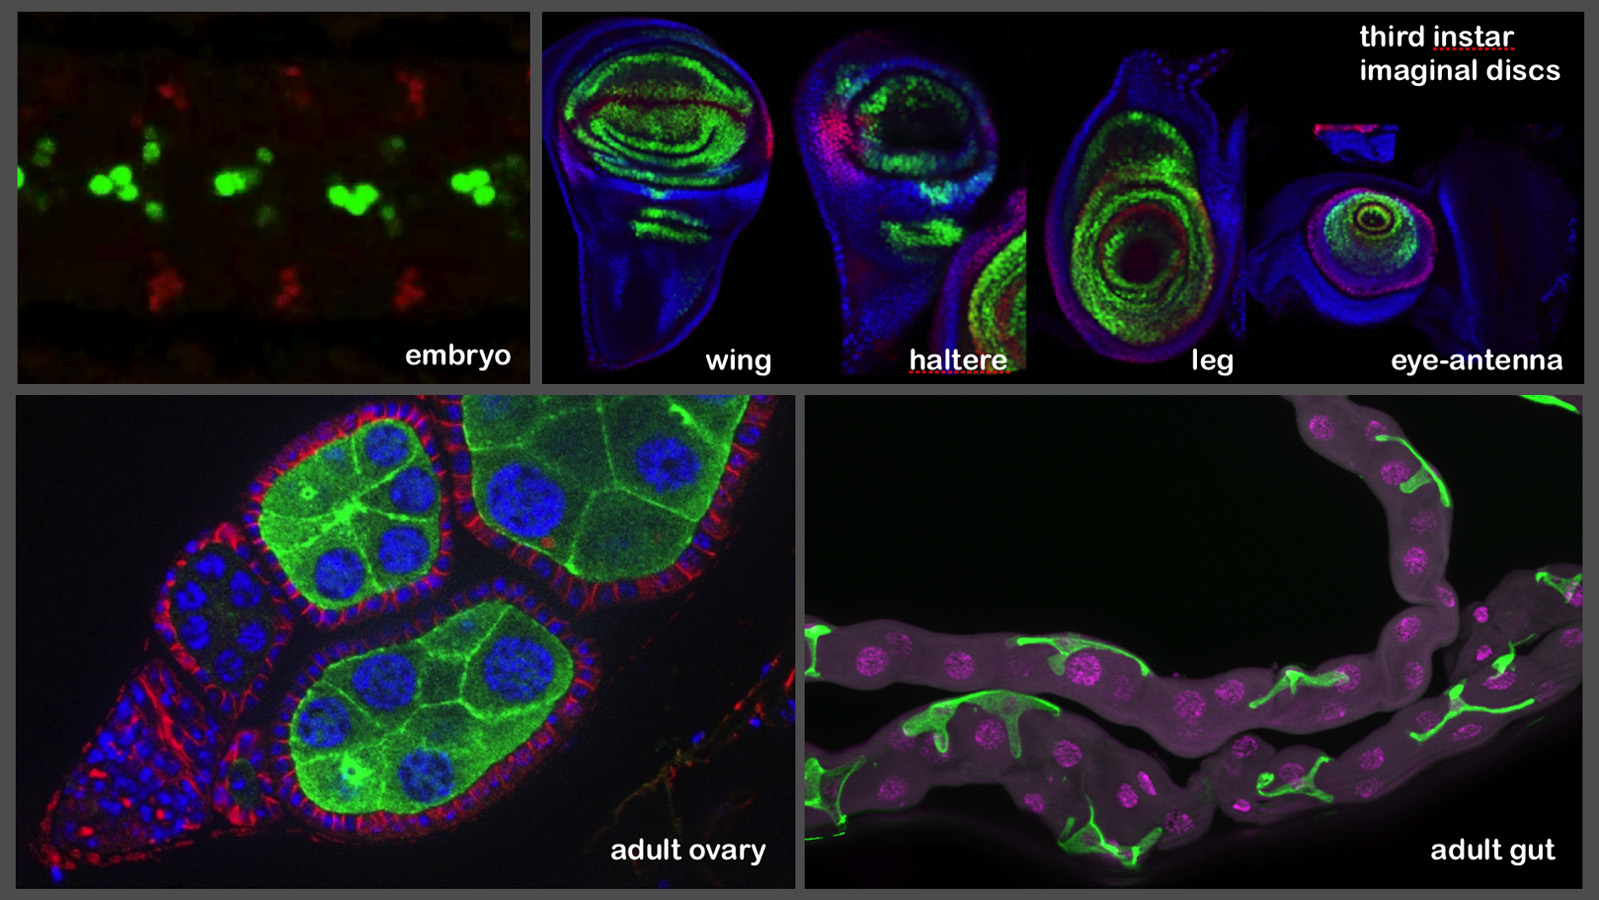
As part of the Janelia visitor program, the expression patterns generated by the lines are also being imaged in the stage 17 embryonic nervous system (by the laboratory of Chris Doe), in the imaginal discs (by the laboratory of Richard Mann) and in adult ovaries and gut (by the laboratory of Allan Spradling). Images from these efforts are shown below:
Key Publications

Pfeiffer BD, et al

Pfeiffer BD, et al

Jenett A, et al