Filter
Associated Lab
- Betzig Lab (2) Apply Betzig Lab filter
- Chklovskii Lab (4) Apply Chklovskii Lab filter
- Eddy/Rivas Lab (6) Apply Eddy/Rivas Lab filter
- Fetter Lab (2) Apply Fetter Lab filter
- Hess Lab (2) Apply Hess Lab filter
- Jayaraman Lab (1) Apply Jayaraman Lab filter
- Leonardo Lab (1) Apply Leonardo Lab filter
- Looger Lab (7) Apply Looger Lab filter
- Magee Lab (3) Apply Magee Lab filter
- Menon Lab (1) Apply Menon Lab filter
- Reiser Lab (1) Apply Reiser Lab filter
- Riddiford Lab (4) Apply Riddiford Lab filter
- Rubin Lab (1) Apply Rubin Lab filter
- Schreiter Lab (2) Apply Schreiter Lab filter
- Shroff Lab (2) Apply Shroff Lab filter
- Simpson Lab (1) Apply Simpson Lab filter
- Spruston Lab (1) Apply Spruston Lab filter
- Sternson Lab (1) Apply Sternson Lab filter
- Svoboda Lab (8) Apply Svoboda Lab filter
- Truman Lab (2) Apply Truman Lab filter
Associated Support Team
Publication Date
- December 2009 (5) Apply December 2009 filter
- November 2009 (2) Apply November 2009 filter
- October 2009 (7) Apply October 2009 filter
- September 2009 (3) Apply September 2009 filter
- August 2009 (2) Apply August 2009 filter
- July 2009 (7) Apply July 2009 filter
- June 2009 (4) Apply June 2009 filter
- May 2009 (4) Apply May 2009 filter
- April 2009 (2) Apply April 2009 filter
- March 2009 (5) Apply March 2009 filter
- February 2009 (4) Apply February 2009 filter
- January 2009 (11) Apply January 2009 filter
- Remove 2009 filter 2009
56 Janelia Publications
Showing 41-50 of 56 resultsRfam is a collection of RNA sequence families, represented by multiple sequence alignments and covariance models (CMs). The primary aim of Rfam is to annotate new members of known RNA families on nucleotide sequences, particularly complete genomes, using sensitive BLAST filters in combination with CMs. A minority of families with a very broad taxonomic range (e.g. tRNA and rRNA) provide the majority of the sequence annotations, whilst the majority of Rfam families (e.g. snoRNAs and miRNAs) have a limited taxonomic range and provide a limited number of annotations. Recent improvements to the website, methodologies and data used by Rfam are discussed. Rfam is freely available on the Web at http://rfam.sanger.ac.uk/and http://rfam.janelia.org/.
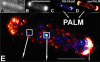
The Escherichia coli chemotaxis network is a model system for biological signal processing. In E. coli, transmembrane receptors responsible for signal transduction assemble into large clusters containing several thousand proteins. These sensory clusters have been observed at cell poles and future division sites. Despite extensive study, it remains unclear how chemotaxis clusters form, what controls cluster size and density, and how the cellular location of clusters is robustly maintained in growing and dividing cells. Here, we use photoactivated localization microscopy (PALM) to map the cellular locations of three proteins central to bacterial chemotaxis (the Tar receptor, CheY, and CheW) with a precision of 15 nm. We find that cluster sizes are approximately exponentially distributed, with no characteristic cluster size. One-third of Tar receptors are part of smaller lateral clusters and not of the large polar clusters. Analysis of the relative cellular locations of 1.1 million individual proteins (from 326 cells) suggests that clusters form via stochastic self-assembly. The super-resolution PALM maps of E. coli receptors support the notion that stochastic self-assembly can create and maintain approximately periodic structures in biological membranes, without direct cytoskeletal involvement or active transport.
Commentary: Our goal as tool developers is to invent methods capable of uncovering new biological insights unobtainable by pre-existing technologies. A terrific example is given by this paper, where grad students Derek Greenfield and Ann McEvoy in Jan Liphardt’s group at Berkeley used our PALM to image the size and position distributions of chemotaxis proteins in E. Coli with unprecedented precision and sensitivity. Their analysis revealed that the cluster sizes follow a stretched exponential distribution, and the density of clusters is highest furthest away from the largest (e.g., polar) clusters. Both observations support a model for passive self-assembly rather than active cytoskeletal assembly of the chemotaxis network.
This paper presents a Laser-based particle detector whose response was enhanced by modulating the Laser diode with a white-noise generator. A Laser sheet was generated to cast a shadow of the object on a 200 dots per inch, 512 x 1 pixels linear sensor array. The Laser diode was modulated with a white-noise generator to achieve stochastic resonance. The white-noise generator essentially amplified the wide-bandwidth (several hundred MHz) noise produced by a reverse-biased zener diode operating in junction-breakdown mode. The gain in the amplifier in the white-noise generator was set such that the Receiver Operating Characteristics plot provided the best discriminability. A monofiber 40 AWG (approximately 80 microm) wire was detected with approximately 88% True Positive rate and approximately 19% False Positive rate in presence of white-noise modulation and with approximately 71% True Positive rate and approximately 15% False Positive rate in absence of white-noise modulation.
Protein kinase A (PKA) plays multiple roles in neurons. The localization and specificity of PKA are largely controlled by A-kinase anchoring proteins (AKAPs). However, the dynamics of PKA in neurons and the roles of specific AKAPs are poorly understood. We imaged the distribution of type II PKA in hippocampal and cortical layer 2/3 pyramidal neurons in vitro and in vivo. PKA was concentrated in dendritic shafts compared to the soma, axons, and dendritic spines. This spatial distribution was imposed by the microtubule-binding protein MAP2, indicating that MAP2 is the dominant AKAP in neurons. Following cAMP elevation, catalytic subunits dissociated from the MAP2-tethered regulatory subunits and rapidly became enriched in nearby spines. The spatial gradient of type II PKA between dendritic shafts and spines was critical for the regulation of synaptic strength and long-term potentiation. Therefore, the localization and activity-dependent translocation of type II PKA are important determinants of PKA function.
Forkhead transcription factors play critical roles in leukocyte homeostasis. To study further the immunological functions of Foxo1, we generated mice that selectively lack Foxo1 in T cells (Foxo1(flox/flox) Lck.cre(+)conditional knockout mice (cKO)). Although thymocyte development appeared relatively normal, Foxo1 cKO mice harbored significantly increased percentages of mature single positive T cells in the thymus as compared with WT mice, yet possessed smaller lymph nodes and spleens that contained fewer T cells. Foxo1 cKO T cells were not more prone to apoptosis, but instead were characterized by a CD62L(lo) CCR7(lo) CD44(hi) surface phenotype, a poorly populated lymphoid compartment in the periphery, and were relatively refractory to TCR stimulation, all of which were associated with reduced expression of Sell, Klf2, Ccr7, and S1pr1. Thus, Foxo1 is critical for naïve T cells to populate the peripheral lymphoid organs by coordinating a molecular program that maintains homeostasis and regulates trafficking.
During the development of the central nervous system (CNS) of Drosophila, neuronal stem cells, the neuroblasts (NBs), first generate a set of highly diverse neurons, the primary neurons that mature to control larval behavior, and then more homogeneous sets of neurons that show delayed maturation and are primarily used in the adult. These latter, ’secondary’ neurons show a complex pattern of expression of broad, which encodes a transcription factor usually associated with metamorphosis, where it acts as a key regulator in the transitions from larva and pupa.
In holometabolous insects, a species-specific size, known as critical weight, needs to be reached for metamorphosis to be initiated in the absence of further nutritional input. Previously, we found that reaching critical weight depends on the insulin-dependent growth of the prothoracic glands (PGs) in Drosophila larvae. Because the PGs produce the molting hormone ecdysone, we hypothesized that ecdysone signaling switches the larva to a nutrition-independent mode of development post-critical weight. Wing discs from pre-critical weight larvae [5 hours after third instar ecdysis (AL3E)] fed on sucrose alone showed suppressed Wingless (WG), Cut (CT) and Senseless (SENS) expression. Post-critical weight, a sucrose-only diet no longer suppressed the expression of these proteins. Feeding larvae that exhibit enhanced insulin signaling in their PGs at 5 hours AL3E on sucrose alone produced wing discs with precocious WG, CT and SENS expression. In addition, knocking down the Ecdysone receptor (EcR) selectively in the discs also promoted premature WG, CUT and SENS expression in the wing discs of sucrose-fed pre-critical weight larvae. EcR is involved in gene activation when ecdysone is present, and gene repression in its absence. Thus, knocking down EcR derepresses genes that are normally repressed by unliganded EcR, thereby allowing wing patterning to progress. In addition, knocking down EcR in the wing discs caused precocious expression of the ecdysone-responsive gene broad. These results suggest that post-critical weight, EcR signaling switches wing discs to a nutrition-independent mode of development via derepression.
Applying modern machine-vision techniques to the study of animal behavior, two groups developed systems that quantify many aspects of the complex social behaviors of Drosophila melanogaster. These software tools will enable high-throughput screens that seek to uncover the cellular and molecular underpinnings of behavior.
Many insect developmental color changes are known to be regulated by both ecdysone and juvenile hormone. Yet the molecular mechanisms underlying this regulation have not been well understood. This review highlights the hormonal mechanisms involved in the regulation of two key enzymes [dopa decarboxylase (DDC) and phenoloxidase] necessary for insect cuticular melanization, and the molecular action of 20-hydroxyecdysone on various transcription factors leading to DDC expression at the end of a larval molt in Manduca sexta. In addition, the ecdysone cascade found in M. sexta is compared with that of other organisms.
Understanding cortical circuits will require mapping the connections between specific populations of neurons, as well as determining the dendritic locations where the synapses occur. The dendrites of individual cortical neurons overlap with numerous types of local and long-range excitatory axons, but axodendritic overlap is not always a good predictor of actual connection strength. Here we developed an efficient channelrhodopsin-2 (ChR2)-assisted method to map the spatial distribution of synaptic inputs, defined by presynaptic ChR2 expression, within the dendritic arborizations of recorded neurons. We expressed ChR2 in two thalamic nuclei, the whisker motor cortex and local excitatory neurons and mapped their synapses with pyramidal neurons in layers 3, 5A and 5B (L3, L5A and L5B) in the mouse barrel cortex. Within the dendritic arborizations of L3 cells, individual inputs impinged onto distinct single domains. These domains were arrayed in an orderly, monotonic pattern along the apical axis: axons from more central origins targeted progressively higher regions of the apical dendrites. In L5 arborizations, different inputs targeted separate basal and apical domains. Input to L3 and L5 dendrites in L1 was related to whisker movement and position, suggesting that these signals have a role in controlling the gain of their target neurons. Our experiments reveal high specificity in the subcellular organization of excitatory circuits.