Filter
Associated Lab
- Aguilera Castrejon Lab (1) Apply Aguilera Castrejon Lab filter
- Ahrens Lab (44) Apply Ahrens Lab filter
- Aso Lab (39) Apply Aso Lab filter
- Baker Lab (19) Apply Baker Lab filter
- Betzig Lab (98) Apply Betzig Lab filter
- Beyene Lab (4) Apply Beyene Lab filter
- Bock Lab (14) Apply Bock Lab filter
- Branson Lab (45) Apply Branson Lab filter
- Card Lab (33) Apply Card Lab filter
- Cardona Lab (44) Apply Cardona Lab filter
- Chklovskii Lab (10) Apply Chklovskii Lab filter
- Clapham Lab (10) Apply Clapham Lab filter
- Cui Lab (19) Apply Cui Lab filter
- Darshan Lab (8) Apply Darshan Lab filter
- Dickson Lab (32) Apply Dickson Lab filter
- Druckmann Lab (21) Apply Druckmann Lab filter
- Dudman Lab (34) Apply Dudman Lab filter
- Eddy/Rivas Lab (30) Apply Eddy/Rivas Lab filter
- Egnor Lab (4) Apply Egnor Lab filter
- Espinosa Medina Lab (12) Apply Espinosa Medina Lab filter
- Feliciano Lab (6) Apply Feliciano Lab filter
- Fetter Lab (31) Apply Fetter Lab filter
- Fitzgerald Lab (15) Apply Fitzgerald Lab filter
- Freeman Lab (15) Apply Freeman Lab filter
- Funke Lab (34) Apply Funke Lab filter
- Gonen Lab (59) Apply Gonen Lab filter
- Grigorieff Lab (34) Apply Grigorieff Lab filter
- Harris Lab (48) Apply Harris Lab filter
- Heberlein Lab (13) Apply Heberlein Lab filter
- Hermundstad Lab (17) Apply Hermundstad Lab filter
- Hess Lab (65) Apply Hess Lab filter
- Ilanges Lab (1) Apply Ilanges Lab filter
- Jayaraman Lab (39) Apply Jayaraman Lab filter
- Ji Lab (33) Apply Ji Lab filter
- Johnson Lab (1) Apply Johnson Lab filter
- Karpova Lab (13) Apply Karpova Lab filter
- Keleman Lab (8) Apply Keleman Lab filter
- Keller Lab (60) Apply Keller Lab filter
- Lavis Lab (123) Apply Lavis Lab filter
- Lee (Albert) Lab (29) Apply Lee (Albert) Lab filter
- Leonardo Lab (19) Apply Leonardo Lab filter
- Li Lab (1) Apply Li Lab filter
- Lippincott-Schwartz Lab (86) Apply Lippincott-Schwartz Lab filter
- Liu (Zhe) Lab (53) Apply Liu (Zhe) Lab filter
- Looger Lab (136) Apply Looger Lab filter
- Magee Lab (31) Apply Magee Lab filter
- Menon Lab (12) Apply Menon Lab filter
- Murphy Lab (6) Apply Murphy Lab filter
- O'Shea Lab (3) Apply O'Shea Lab filter
- Otopalik Lab (1) Apply Otopalik Lab filter
- Pachitariu Lab (28) Apply Pachitariu Lab filter
- Pastalkova Lab (5) Apply Pastalkova Lab filter
- Pavlopoulos Lab (7) Apply Pavlopoulos Lab filter
- Pedram Lab (3) Apply Pedram Lab filter
- Podgorski Lab (16) Apply Podgorski Lab filter
- Reiser Lab (43) Apply Reiser Lab filter
- Riddiford Lab (20) Apply Riddiford Lab filter
- Romani Lab (28) Apply Romani Lab filter
- Rubin Lab (101) Apply Rubin Lab filter
- Saalfeld Lab (41) Apply Saalfeld Lab filter
- Satou Lab (1) Apply Satou Lab filter
- Scheffer Lab (36) Apply Scheffer Lab filter
- Schreiter Lab (44) Apply Schreiter Lab filter
- Shroff Lab (22) Apply Shroff Lab filter
- Simpson Lab (18) Apply Simpson Lab filter
- Singer Lab (37) Apply Singer Lab filter
- Spruston Lab (55) Apply Spruston Lab filter
- Stern Lab (69) Apply Stern Lab filter
- Sternson Lab (47) Apply Sternson Lab filter
- Stringer Lab (24) Apply Stringer Lab filter
- Svoboda Lab (131) Apply Svoboda Lab filter
- Tebo Lab (7) Apply Tebo Lab filter
- Tervo Lab (9) Apply Tervo Lab filter
- Tillberg Lab (14) Apply Tillberg Lab filter
- Tjian Lab (17) Apply Tjian Lab filter
- Truman Lab (58) Apply Truman Lab filter
- Turaga Lab (34) Apply Turaga Lab filter
- Turner Lab (24) Apply Turner Lab filter
- Vale Lab (6) Apply Vale Lab filter
- Voigts Lab (1) Apply Voigts Lab filter
- Wang (Meng) Lab (8) Apply Wang (Meng) Lab filter
- Wang (Shaohe) Lab (4) Apply Wang (Shaohe) Lab filter
- Wu Lab (8) Apply Wu Lab filter
- Zlatic Lab (26) Apply Zlatic Lab filter
- Zuker Lab (5) Apply Zuker Lab filter
Associated Project Team
- CellMap (1) Apply CellMap filter
- COSEM (3) Apply COSEM filter
- Fly Descending Interneuron (10) Apply Fly Descending Interneuron filter
- Fly Functional Connectome (14) Apply Fly Functional Connectome filter
- Fly Olympiad (5) Apply Fly Olympiad filter
- FlyEM (51) Apply FlyEM filter
- FlyLight (46) Apply FlyLight filter
- GENIE (40) Apply GENIE filter
- Integrative Imaging (1) Apply Integrative Imaging filter
- Larval Olympiad (2) Apply Larval Olympiad filter
- MouseLight (16) Apply MouseLight filter
- NeuroSeq (1) Apply NeuroSeq filter
- ThalamoSeq (1) Apply ThalamoSeq filter
- Tool Translation Team (T3) (24) Apply Tool Translation Team (T3) filter
- Transcription Imaging (45) Apply Transcription Imaging filter
Associated Support Team
- Anatomy and Histology (18) Apply Anatomy and Histology filter
- Cryo-Electron Microscopy (33) Apply Cryo-Electron Microscopy filter
- Electron Microscopy (11) Apply Electron Microscopy filter
- Fly Facility (39) Apply Fly Facility filter
- Gene Targeting and Transgenics (11) Apply Gene Targeting and Transgenics filter
- Integrative Imaging (10) Apply Integrative Imaging filter
- Janelia Experimental Technology (35) Apply Janelia Experimental Technology filter
- Management Team (1) Apply Management Team filter
- Molecular Genomics (15) Apply Molecular Genomics filter
- Primary & iPS Cell Culture (13) Apply Primary & iPS Cell Culture filter
- Project Technical Resources (34) Apply Project Technical Resources filter
- Quantitative Genomics (18) Apply Quantitative Genomics filter
- Scientific Computing Software (58) Apply Scientific Computing Software filter
- Scientific Computing Systems (6) Apply Scientific Computing Systems filter
- Viral Tools (14) Apply Viral Tools filter
- Vivarium (6) Apply Vivarium filter
Publication Date
- 2024 (121) Apply 2024 filter
- 2023 (175) Apply 2023 filter
- 2022 (166) Apply 2022 filter
- 2021 (174) Apply 2021 filter
- 2020 (177) Apply 2020 filter
- 2019 (177) Apply 2019 filter
- 2018 (206) Apply 2018 filter
- 2017 (186) Apply 2017 filter
- 2016 (191) Apply 2016 filter
- 2015 (195) Apply 2015 filter
- 2014 (190) Apply 2014 filter
- 2013 (136) Apply 2013 filter
- 2012 (112) Apply 2012 filter
- 2011 (98) Apply 2011 filter
- 2010 (61) Apply 2010 filter
- 2009 (56) Apply 2009 filter
- 2008 (40) Apply 2008 filter
- 2007 (21) Apply 2007 filter
- 2006 (3) Apply 2006 filter
2485 Janelia Publications
Showing 91-100 of 2485 resultsWe report an intensiometric, near-infrared fluorescent, genetically encoded calcium ion (Ca) indicator (GECI) with excitation and emission maxima at 678 and 704 nm, respectively. This GECI, designated NIR-GECO1, enables imaging of Ca transients in cultured mammalian cells and brain tissue with sensitivity comparable to that of currently available visible-wavelength GECIs. We demonstrate that NIR-GECO1 opens up new vistas for multicolor Ca imaging in combination with other optogenetic indicators and actuators.
Adenosine 5' triphosphate (ATP) is a universal intracellular energy source and an evolutionarily ancient, ubiquitous extracellular signal in diverse species. Here, we report the generation and characterization of single-wavelength genetically encoded fluorescent sensors (iATPSnFRs) for imaging extracellular and cytosolic ATP from insertion of circularly permuted superfolder GFP into the epsilon subunit of FF-ATPase from Bacillus PS3. On the cell surface and within the cytosol, iATPSnFR responds to relevant ATP concentrations (30 μM to 3 mM) with fast increases in fluorescence. iATPSnFRs can be genetically targeted to specific cell types and sub-cellular compartments, imaged with standard light microscopes, do not respond to other nucleotides and nucleosides, and when fused with a red fluorescent protein function as ratiometric indicators. After careful consideration of their modest pH sensitivity, iATPSnFRs represent promising reagents for imaging ATP in the extracellular space and within cells during a variety of settings, and for further application-specific refinements.
We describe the generation of a family of high-signal-to-noise single-wavelength genetically encoded indicators for maltose. This was achieved by insertion of circularly permuted fluorescent proteins into a bacterial periplasmic binding protein (PBP), Escherichia coli maltodextrin-binding protein, resulting in a four-color family of maltose indicators. The sensors were iteratively optimized to have sufficient brightness and maltose-dependent fluorescence increases for imaging, under both one- and two-photon illumination. We demonstrate that maltose affinity of the sensors can be tuned in a fashion largely independent of the fluorescent readout mechanism. Using literature mutations, the binding specificity could be altered to moderate sucrose preference, but with a significant loss of affinity. We use the soluble sensors in individual E. coli bacteria to observe rapid maltose transport across the plasma membrane, and membrane fusion versions of the sensors on mammalian cells to visualize the addition of maltose to extracellular media. The PBP superfamily includes scaffolds specific for a number of analytes whose visualization would be critical to the reverse engineering of complex systems such as neural networks, biosynthetic pathways, and signal transduction cascades. We expect the methodology outlined here to be useful in the development of indicators for many such analytes.
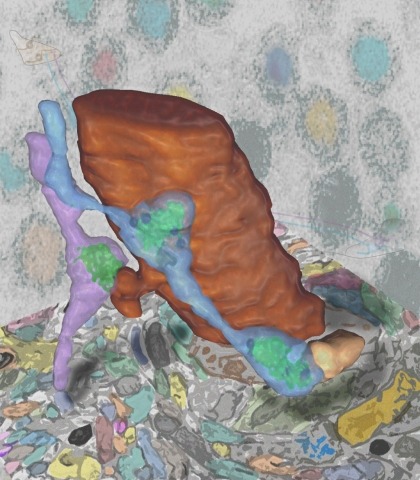
Synaptic connectivity and molecular composition provide a blueprint for information processing in neural circuits. Detailed structural analysis of neural circuits requires nanometer resolution, which can be obtained with serial-section electron microscopy. However, this technique remains challenging for reconstructing molecularly defined synapses. We used a genetically encoded synaptic marker for electron microscopy (GESEM) based on intra-vesicular generation of electron-dense labeling in axonal boutons. This approach allowed the identification of synapses from Cre recombinase-expressing or GAL4-expressing neurons in the mouse and fly with excellent preservation of ultrastructure. We applied this tool to visualize long-range connectivity of AGRP and POMC neurons in the mouse, two molecularly defined hypothalamic populations that are important for feeding behavior. Combining selective ultrastructural reconstruction of neuropil with functional and viral circuit mapping, we characterized some basic features of circuit organization for axon projections of these cell types. Our findings demonstrate that GESEM labeling enables long-range connectomics with molecularly defined cell types.
Neural computation in biological and artificial networks relies on nonlinear synaptic integration. The structural connectivity matrix of synaptic weights between neurons is a critical determinant of overall network function. However, quantitative links between neural network structure and function are complex and subtle. For example, many networks can give rise to similar functional responses, and the same network can function differently depending on context. Whether certain patterns of synaptic connectivity are required to generate specific network-level computations is largely unknown. Here we introduce a geometric framework for identifying synaptic connections required by steady-state responses in recurrent networks of rectified-linear neurons. Assuming that the number of specified response patterns does not exceed the number of input synapses, we analytically calculate all feedforward and recurrent connectivity matrices that can generate the specified responses from the network inputs. We then use this analytical characterization to rigorously analyze the solution space geometry and derive certainty conditions guaranteeing a non-zero synapse between neurons. Numerical simulations of feedforward and recurrent networks verify our analytical results. Our theoretical framework could be applied to neural activity data to make anatomical predictions that follow generally from the model architecture. It thus provides novel opportunities for discerning what model features are required to accurately relate neural network structure and function.
Considerable attention has been recently paid to improving replicability and reproducibility in life science research. This has resulted in commendable efforts to standardize a variety of reagents, assays, cell lines and other resources. However, given that microscopy is a dominant tool for biologists, comparatively little discussion has been offered regarding how the proper reporting and documentation of microscopy relevant details should be handled. Image processing is a critical step of almost any microscopy-based experiment; however, improper, or incomplete reporting of its use in the literature is pervasive. The chosen details of an image processing workflow can dramatically determine the outcome of subsequent analyses, and indeed, the overall conclusions of a study. This Review aims to illustrate how proper reporting of image processing methodology improves scientific reproducibility and strengthens the biological conclusions derived from the results.
Olshausen and Field (OF) proposed that neural computations in the primary visual cortex (V1) can be partially modelled by sparse dictionary learning. By minimizing the regularized representation error they derived an online algorithm, which learns Gabor-filter receptive fields from a natural image ensemble in agreement with physiological experiments. Whereas the OF algorithm can be mapped onto the dynamics and synaptic plasticity in a single-layer neural network, the derived learning rule is nonlocal - the synaptic weight update depends on the activity of neurons other than just pre- and postsynaptic ones – and hence biologically implausible. Here, to overcome this problem, we derive sparse dictionary learning from a novel cost-function - a regularized error of the symmetric factorization of the input’s similarity matrix. Our algorithm maps onto a neural network of the same architecture as OF but using only biologically plausible local learning rules. When trained on natural images our network learns Gabor-filter receptive fields and reproduces the correlation among synaptic weights hard-wired in the OF network. Therefore, online symmetric matrix factorization may serve as an algorithmic theory of neural computation.
A large number of degrees of freedom are required to produce a high quality focus through random scattering media. Previous demonstrations based on spatial phase modulations suffer from either a slow speed or a small number of degrees of freedom. In this work, a high speed wavefront determination technique based on spatial frequency domain wavefront modulations is proposed and experimentally demonstrated, which is capable of providing both a high operation speed and a large number of degrees of freedom. The technique was employed to focus light through a strongly scattering medium and the entire wavefront was determined in 400 milliseconds, three orders of magnitude faster than the previous report.
We demonstrate a high throughput, large compensation range, single-prism femtosecond pulse compressor, using a single prism and two roof mirrors. The compressor has zero angular dispersion, zero spatial dispersion, zero pulse-front tilt, and unity magnification. The high efficiency is achieved by adopting two roof mirrors as the retroreflectors. We experimentally achieved ~ -14500 fs2 group delay dispersion (GDD) with 30 cm of prism tip-roof mirror prism separation, and ~90.7% system throughput with the current implementation. With better components, the throughput can be even higher.