We have developed strategies for multicolor stochastic labeling that employ several constructs operating independently and in parallel, each with a flp-out-stop cassette upstream of a unique epitope as shown in diagram below (Nern et al. 2015). We call these methods Multicolor Flip-Out or MCFO.

Schematic of smGFP markers. Multiple copies of a single epitope-tag (HA, FLAG, MYC, V5 or OLLAS; filled blue circles) are inserted in groups into a backbone of myristoylated (yellow circle) non-fluorescent superfolder GFP (grey). (B) Schematic of an individual MCFO reporter with ten Upstream Activating Sequences (10XUAS) and a core promoter for GAL4-activated expression, a transcriptional terminator flanked by Flip-recombinase Target Recognition (FRT) sites and an smGFP marker (Viswanathan et. al 2015) (C) Potential marker combinations with three MCFO stop-cassettes with different smGFPs: Unlabeled (grey), one marker (red, green, blue) or combinations of two (yellow, magenta, cyan) or three (white) labels. This results in neurons being unlabeled or labeled in one of up to seven distinct colors.
The level of flp recombinase expressed determines the density of labeling. Additional colors can be added by adding constructs. We find this method to be more versatile than the “Brainbow” approach for our applications.
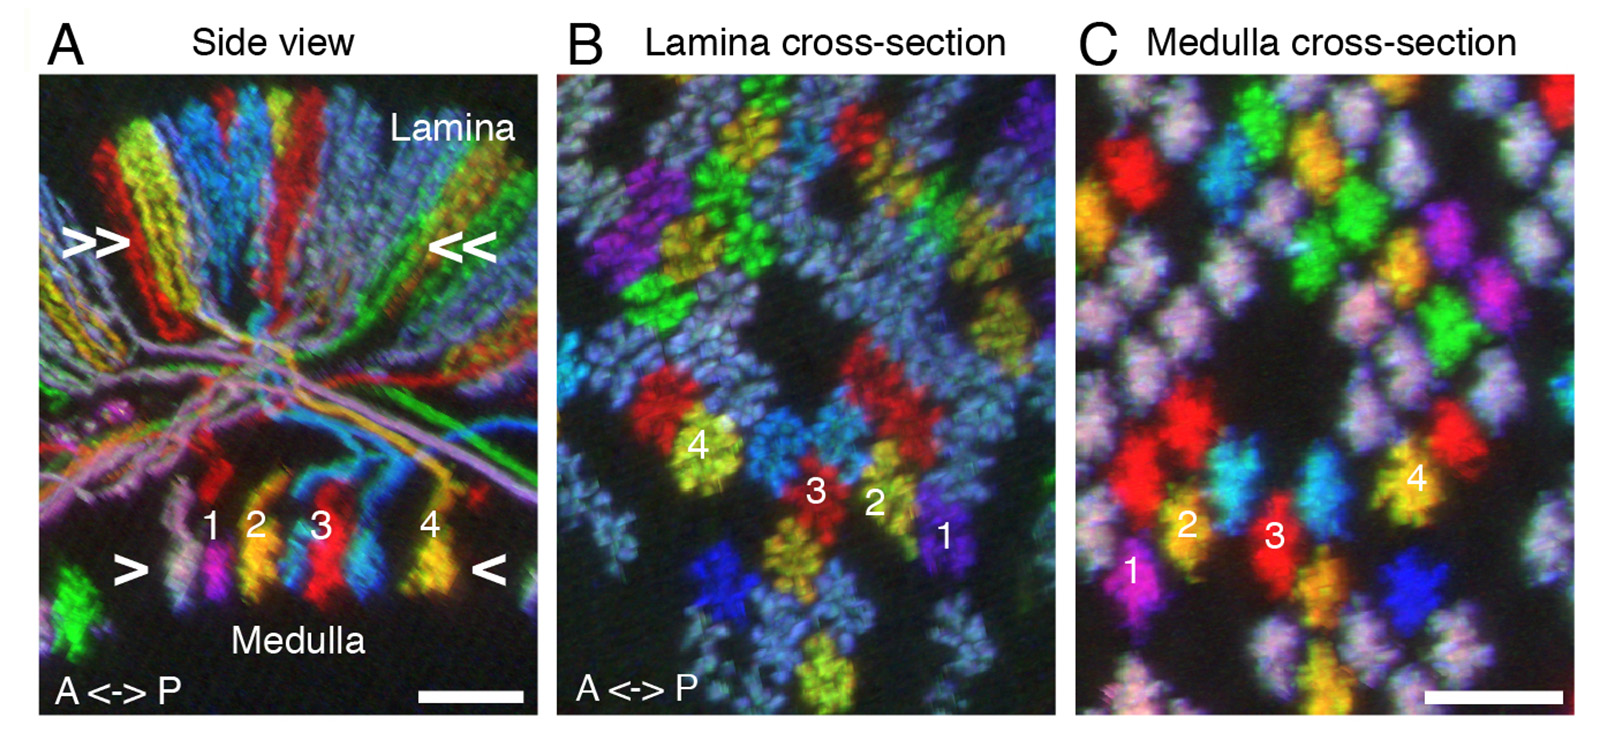
(A-C) MCFO for comparing relative positions of neurons in different brain regions. All images are resampled views of the same image stack generated computationally. Side view (A) and cross-section views (B,C) of T1 neurons in lamina (A,B) and medulla (A,C). Relative positions of T1 terminals in the arrays in lamina (B) and medulla (C) are maintained except that axon cross-over in the first optic chiasm inverts positions along the anterior-posterior axis (see numbered cells for examples. Approximate levels of the cross-section views shown in (B) and (C) are indicated in (A).
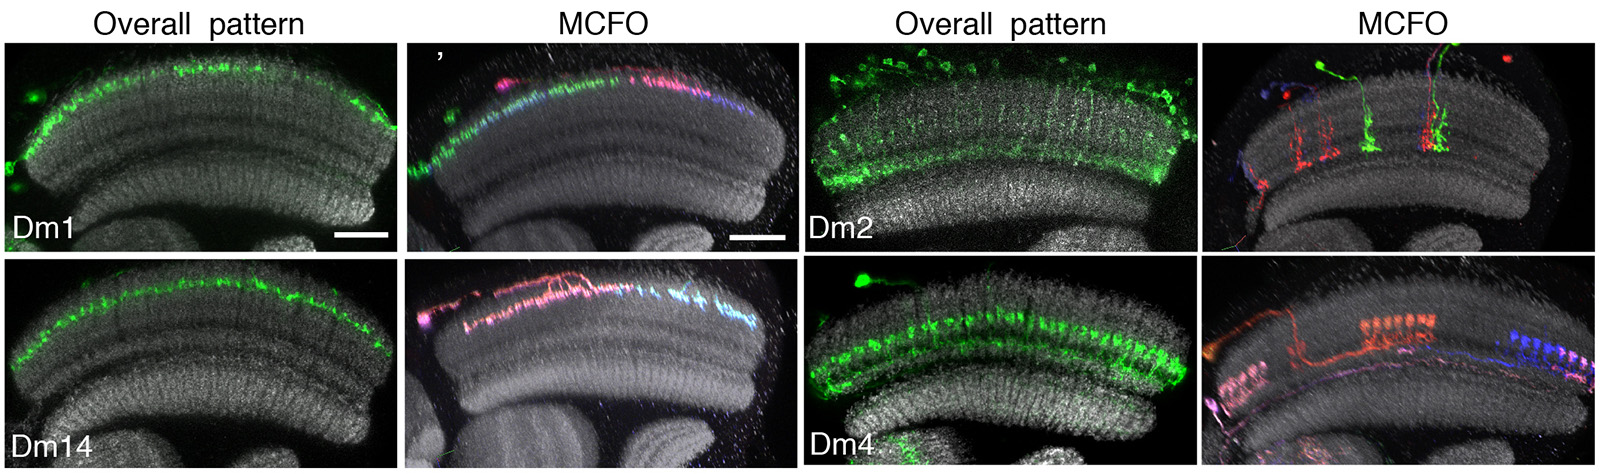
Working with the FlyLight project team we use the MCFO methods to determine the structures of individual neurons for three distinct purposes. First, in the optic lobes we have examined neurons produced by very sparse labeling of pan-neuronal drivers as a way of ensuring complete coverage of our anatomical description of optic lobe neurons (Nern et al. 2015). In this way, we have identified many neurons not described in earlier studies. Second, we have cataloged the neurons that are part of the expression patterns of selected sparse GAL4 lines (see image below), largely as a way of identifying suitable partner enhancers for split-GAL4 line generation. Finally, we use MCFO to fully describe the morphology of the neurons in the expression patterns of our split-GAL4 lines. These high-resolution single neuron morphologies are usually sufficient to identify the corresponding neurons in EM level reconstructions of the fly brain.