Generation 1 GAL4 Lines
In Generation 1 lines, GAL4 expression is controlled by a genomic DNA fragment of known sequence (2-3kb) in a construct that has been inserted at a defined genomic location (Pfeiffer et al. 2008). In the initial two years of FlyLight, we imaged and analyzed more than 7,000 lines in the brain, optic lobes and Ventral Nerve Cord (VNC). The data have been made available and can be searched by expression pattern, gene or line name. The original confocal stacks (~500 MB each) can be downloaded from this web site and we also distributed the full collection of original data (~5TB) to 30 laboratories by distribution on hard disk. A paper reporting these results was published (Jenett et al). Over 500 different laboratories have requested subsets of these lines. Collaborating groups have studied the expression patterns of the GAL4 lines in the embryonic nervous system (Manning) and in third instar imaginal discs (Jory).
Barry Dickson brought 2,800 GAL4 lines, made in the same vector, with him from Vienna when he moved to Janelia in 2013. These “VT lines” were selected from the larger collection of over 8,000 lines that are available from the VDRC stock center. Since the expression patterns of these lines were imaged in a manner that did not include the optic lobes or the VNCs, we re-imaged these 2,800 lines by our standard protocol; the Vienna images were of males and ours of females. The VT lines are now fully imaged and compatible with the existing collection, providing a significant increase in the tools we have available to study specific neurons and cell types.
LexA Lines
LexA lines are very useful reagents in conjunction with the GAL4 lines for double labeling experiments and for determining functional connectivity. We selected 1,500 “enhancer” fragments based on their GAL4 expression patterns, and then used them to construct and image LexA driver lines using the vectors described in Pfeiffer et al. (4). Their images are available on our web site. We also re-imaged ~1,200 LexA lines, selected from those generated in Vienna.
Characterization of GAL4 Lines using the Multi-Color-Flip-Out (MCFO) Approach
In order to examine the morphology of individual cells we used the MCFO stochastic labeling method illustrated in Figure 1 (Nern et al., 2015).
We have used MCFO for three main purposes:
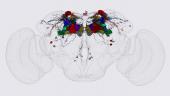
(1) “Golgi 2.0” analysis to catalog and determine the morphology of all cell types in a given brain area, in our case the optic lobes. We have segmented and characterized the morphology of over 10,000 individual optic lobe cells derived from images of ~7,000 optic lobes in which stochastic flip out was done using a pan-neuronal GAL4 driver (Nern et al., unpublished; see Fig). We discovered many cell types not observed in previous analyses of this heavily studied brain area, important in interpreting and validating the EM connectome of this region.
Figure 1: Example of cell types in the distal medulla.

(2) Characterization of individual GAL4 lines for neuroanatomical studies and for predicting good split intersections (optic lobes, central complex). We performed MCFO on approximately 1,500 different GAL4 driver lines, with an average of 6 brains imaged per line. This has proven to be very useful for directed anatomical studies of a brain area, such as the central complex (see Figure 2). In addition, knowing what cell types are present in the expression pattern of a given line informs the selection of lines to use in the split-GAL4 approach.
Figure 2: MCFO of GAL4 lines that express in ellipsoid body ring neurons

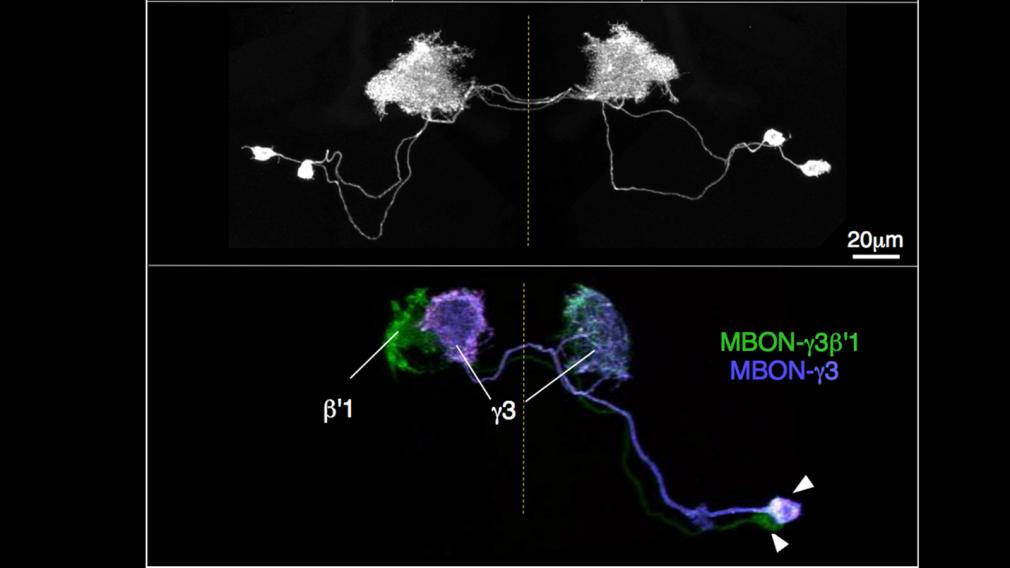
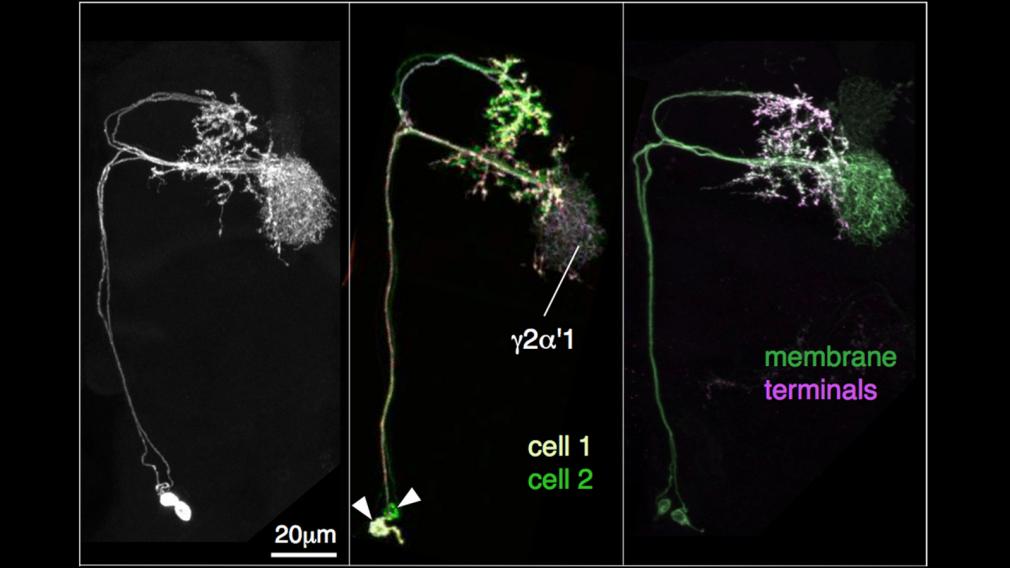
(3) Characterization of split-GAL4 lines (optic lobes, central complex, mushroom bodies, etc.). After a stable stock of a split-GAL4 line that was selected in our screening process is established we perform two imaging protocols. First, the complete pattern of the line and the overall polarity of the neurons that comprise it are established by simultaneous use of two reporters: UASmyr::FLAG (to label membranes) and UAS-synaptotagmin::HA (to label synaptic zones). Second, MCFO is performed to get an inventory of the cells labeled in the line and determine their morphologies. This also allows us to assess if the split-GAL4 line is cell-type-specific. Because we are unaware of a universally accepted definition of a “cell type”, we adopted an operational definition based on two criteria we can readily assess: (1) The cells must be coexpressed in a split-GAL4 line; and (2) The cells must be morphologically indistinguishable. The split-GAL4 lines that we retained in the final collection are generally expressed in one or two cell types.
Producing Lines with Sparse Expression Patterns using the Split-GAL4 Approach
Traditional enhancer trap GAL4 lines (“Generation 0” lines) are expressed, on average, in 300-500 cells of the 30,000-40,000 cells of the central adult fly brain, whereas our Generation 1 lines are expressed more sparsely, in an average of ~100 cells (Jenett). We originally thought that this cell number would be a good compromise between having a very small number of “cell types” represented in each line while having sufficient cells in each line to allow complete coverage of all the neurons in the brain with a reasonable number of lines. But it became clear that we overestimated the number of cells that constitute a “cell type.” Our later data using intersectional strategies to refine expression patterns indicates that a typical “cell type” in the adult brain may contain, on average, only two to ten cells. This in turn implies that, in the adult brain, our Generation 1 GAL4 lines include about 15 “cell types.” (The situation in the larva, which has one-tenth the number of cells of the adult, is far more favorable.) Because of this, it has proven to be difficult and tedious to sort out the specific cells responsible for a behavioral alteration observed in the adult when the activity of the cells expressed in one of the GAL4 driver lines has been altered. Moreover, in order to do meaningful perturbation experiments with optogenetic tools in freely moving animals (Kloeptke), where the specificity of the manipulation depends almost exclusively on the sparseness of the line, it is critical to have access to a good collection of sparse lines.
We have demonstrated that we can construct such sparse lines through the positive intersection of the expression patterns visualized by selected pairs of our GAL4 lines using the split-GAL4 approach. The combined collections of lines made at Janelia and in Vienna, include over 4,000 constructs that express the DNA binding (DBD) half of GAL4 under a different enhancer and over 4,000 constructs that express its activation domain (AD) half. These constructs would allow us to make over 10 million unique split-GAL4 intersections. (There is not complete overlap in the enhancers used for the DBD and AD constructs.). From our detailed studies in the lamina (Tuthill), mushroom body (Aso) and protocerebral bridge (T. Wolff), we believe we can achieve highly specific lines for greater than 90% of cell types using these reagents.
Thus the task was to identify pairs of DBD and AD lines that contain each desired neuronal cell type and to establish a rapid screening pipeline. We relied on expert human anatomists to identify pairs of lines to test, later adding computational approaches.

Our areas of focus included the following brain areas: Mushroom Body (Yoshi Aso), Visual system (Aljoscha Nern), Central complex (Tanya Wolff), Descending interneurons (Shigehiro Namiki, Descending Interneuron Team Project, Card Lab), Fruitless circuit (Barry Dickson), and Lateral Horn (Jefferis/Rubin Labs).