by Lou Scheffer, Principal Scientist
July 30, 2019
Comparative connectomics is a simple and appealing idea. Examine the brain of an animal that has learned a task, or has a genetic variant, and compare it to the brain of a control animal. This seems particularly appealing in the brain of the fruit fly, where the organization and circuits of the brain are very similar from animal to animal. But this is a lot harder than it first appears.
To conclude any differences are due to experimental conditions, they would need to fall outside the range of normal variation. But normal variation is itself poorly understood. There are at least five types of such variation. The first is variation within a single animal - typically between left and right sides, or between repeated circuits (such as the processing that lies behind each pixel of the fly’s compound eye). Next is variation between two genetically identical animals, raised in identical conditions (as far as possible), measured at the same age. Then there are variations with age, and variations with external conditions such as nutrition, crowding, or day/night cycles during development. Finally there are variations between sexes, between strains of the same species, then differences between species.
On top of this biological variation, there are variations due to connectomic techniques - different experiments have used different staining, fixation, slicing (FIBSEM or microtome), and different EM techniques (transmission vs scanning electron microscopes), and different reconstruction methodologies (sparse or dense). All of these affect how easy synapses are to spot and to count.
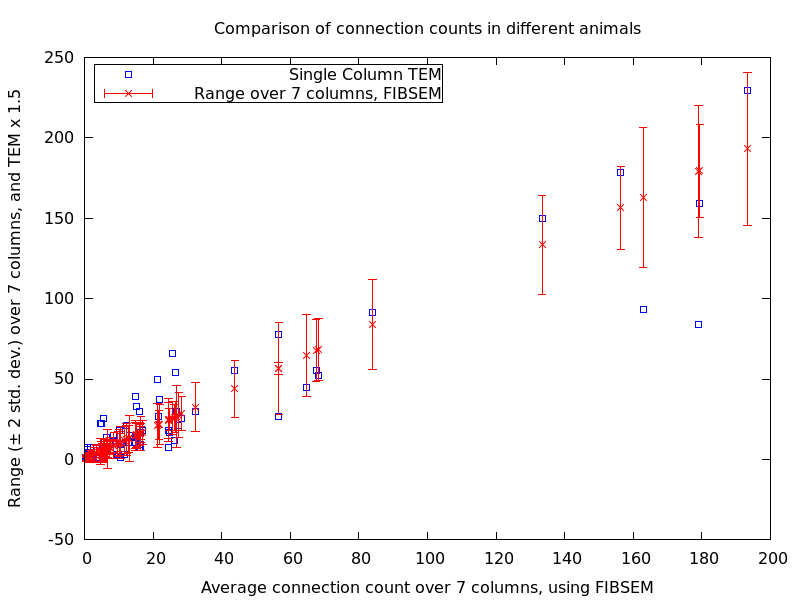
Since connectomics so far is difficult, expensive, and time consuming, most of these combinations have not been studied explicitly. The only data with consistent conditions is that of multiple circuits in the same fly. Only in this case do the circuits share the same genetics, history, sex, age, and the same sample preparation and analysis. Even so, the variation at the circuit level is large - the variance is roughly equal to the synapse count, as can be seen in the figure below. So if in one column two neurons are connected by 100 synapses, then the neighboring column would likely differ with a standard deviation of 10. So a 3 sigma effect would require showing less than 70 or more than 130 synapses.

All other examples have differences in multiple variables at the same time - for example, we have two examples of a densely reconstructed optic lobe column of a fly. But one was microtome/TEM, and one was FIBSEM. We have two densely reconstructed mushroom bodies, both using FIBSEM, but one was male and one female. There are two efforts to reconstruct the majority of the adult fly brain, but one is microtome/TEM with sparse reconstruction, and the other FIBSEM with dense reconstruction. Furthermore the flies were different ages, raised in different conditions, and fixed/stained/prepared with different techniques. When comparing circuits under these different conditions, a factor of two difference in synapse counts is not unusual.
The net result is that subtle changes observed in comparative connectomics will be difficult to ascribe to experimental conditions. Cheaper connectomics will help by enabling larger sample sizes, but any technique based on EM faces the fundamental problem that it obtains only one time point per animal. This means temporal circuit variation, such as learning and memory, will be difficult to see among the noise of other reasons for circuit differences. Overall, comparative connectomics, for now, will be limited to cases where the suspected circuit differences are large.
For example, Larry Zipursky has found genetic changes that cause neurons to target the wrong layer in the medulla. What do these neurons do when they get there? Connect to the neurons there even if they are the wrong partner? Refuse to form connections? Connect to neurons of the same neurotransmitter? The answers, straightforward with comparative connectomics, could tell us a great deal about how connections are developed and wired, and how a relatively simple genome directs the complex wiring of the brain. These are areas where our understanding is primitive, and comparative connectomics offers a path to better understanding.
