by William Katz, Senior Software Engineer of FlyEM
October 18, 2019
Data engineering can be an unglamorous aspect of connectomics compared to 3D visualization and deep learning. Yet the choices we make in how to store and access data impact every part of our reconstruction pipeline, including how we distribute the data and collaboratively edit it.
Building a connectome requires a lot of data handling from the time grayscale images first roll off the electron microscopes through each step of a complex pipeline. Necessary steps include alignment of the massive image volumes, automated segmentation and synapse detection, manual proofreading and data exploration, and finally analysis. These steps are accomplished using a mix of custom programs, proofreading tools (NeuTu, Neuroglancer), and analysis tools like neuPrint. Let’s use the term clients to describe all these programs and tools that use data. In this post, we’ll focus on the main FlyEM data systems that clients use to access versioned (i.e., occasionally checkpointed) data within a stable, post-alignment image space.
The primary data used to build the connectome are:
- The aligned EM “grayscale” image volume.
- Segmentation of neurons in the form of an unsigned 64-bit integer for every voxel in the volume.
- A collection of 3D points marking synaptic elements and the relationship between them.
In addition to the above data, we have regions of interest (ROIs), notes placed at 3D points, and a significant amount of workflow data used to manage proofreader assignments and the state of clients like NeuTu.
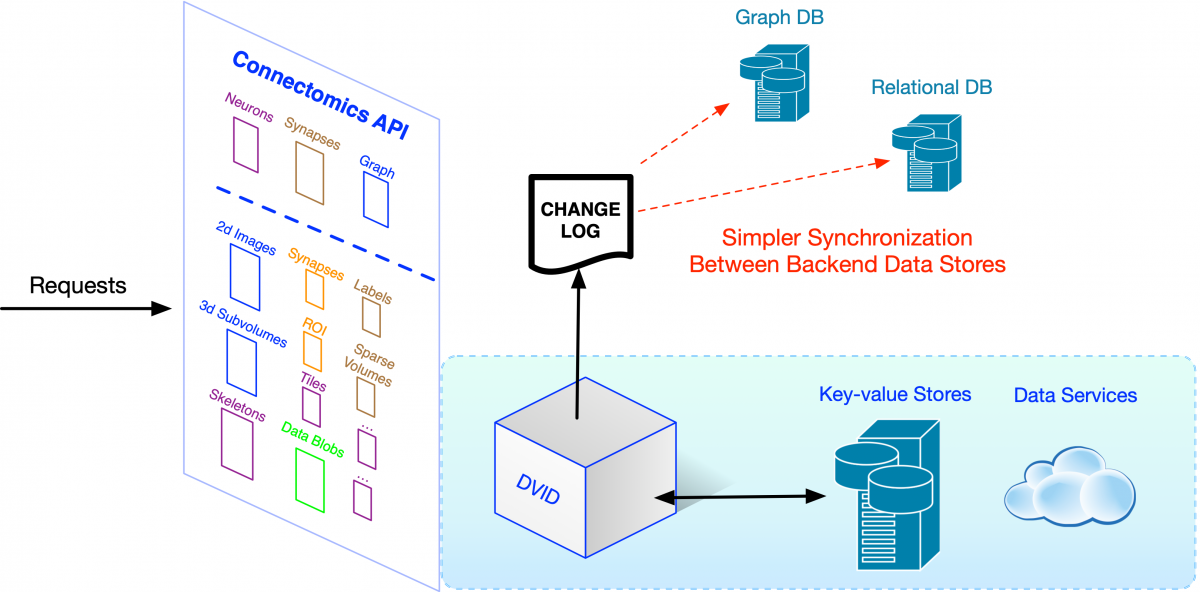
How would clients access all this data? One way would be to store them in files and require each client to know how to process the files and retrieve the necessary information. This file-based approach has a number of downsides including requiring each client to deal with low-level file parsing and being unable to change the way data is stored without causing changes in all clients. Ideally, we want to access data at the highest level of abstraction, where the API and data format is directly related to the science we want to do. HTTP, the standard protocol for web-based communication, makes sense given web-based clients like Neuroglancer. So we’ve adopted a high-level Connectomics HTTP API handled mainly by DVID.
 Asking for data or initiating changes like a merge of neuron fragments is a simple HTTP request. For example, we can get a 128x128x128 voxel subvolume of uint64 label data with its corner at voxel (100,200,300) using the following request (using the great tool httpie for simplicity):
% http GET http://myserver/api/node/f8a03/segmentation/raw/128_128_128/100_200_300
Merges and other types of changes require a POST request where a JSON array [target, label1, label2] specifies that label1 and label2 should be merged into target:
% echo “[3, 1, 2]” | http POST http://myserver/api/node/f8a03/segmentation/merge
Note that our example HTTP requests required a version identifier (“f8a03”) so we know the exact version of data that is being read or modified. We also have other parts of our Connectomics API that don’t require versioning and implicitly assume all operations are at the “current” version. We’ll discuss versioning in future blog posts, but the general idea is that we want to easily checkpoint and branch data at various times for provenance, proofreader training, quality control, and data distribution.
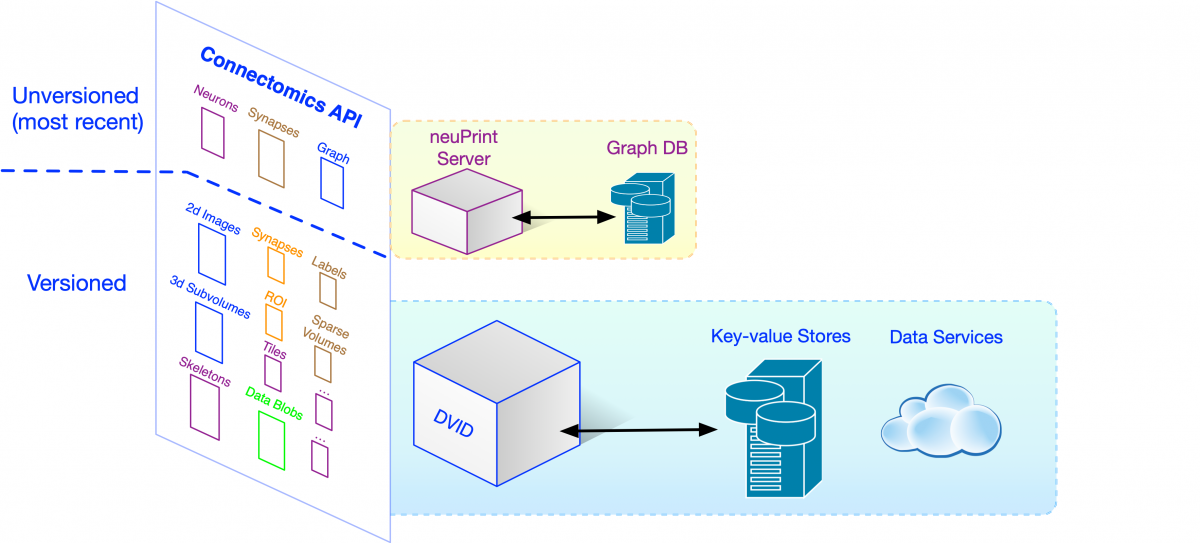
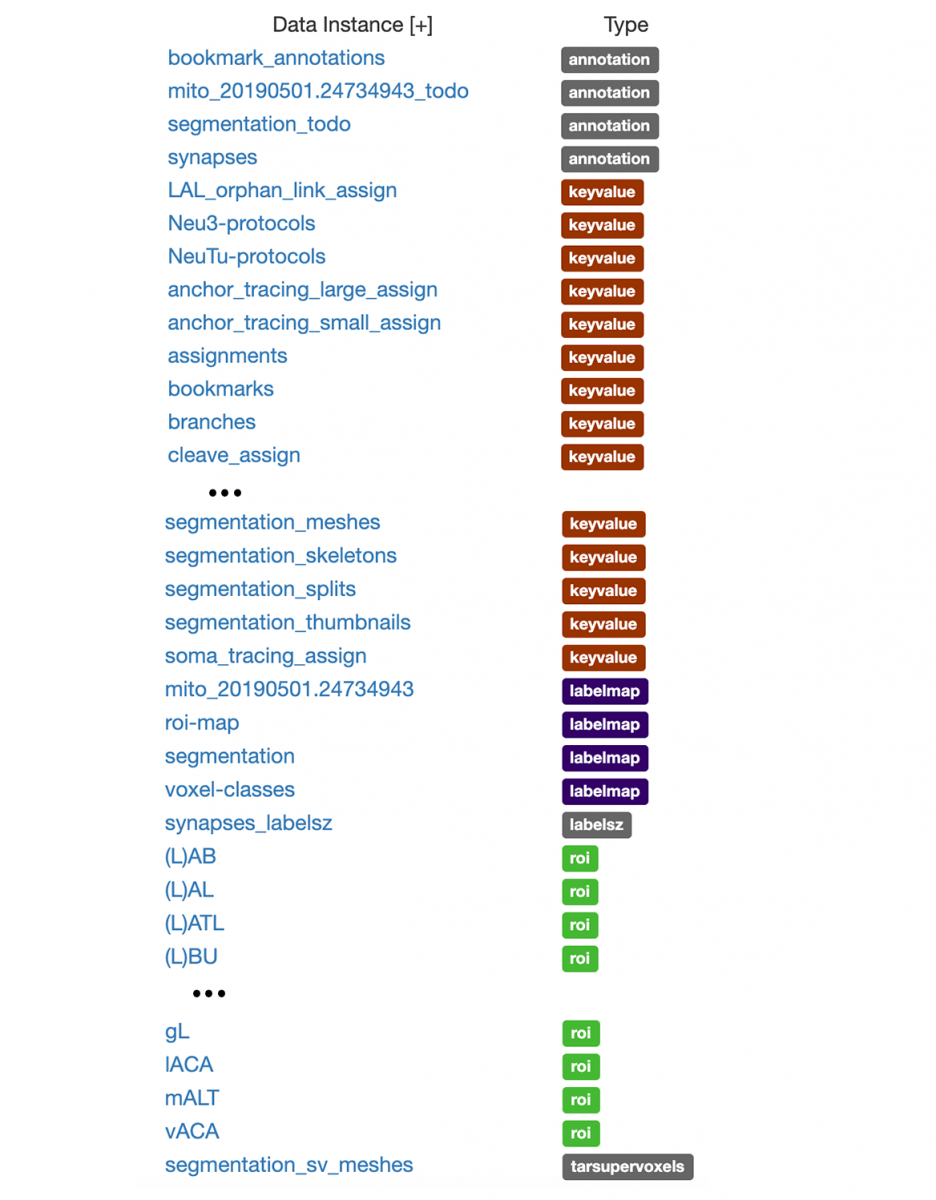
The high-level Connectomics API is implemented in DVID by a number of data types like labelmap for segmentation and annotation for synapse data. We’ve depicted each data type’s API by a small colored box in the figure above. The FlyEM team can create any number of instances of a data type in a DVID server, and store and retrieve data using the name of the instance (e.g., the “segmentation” instance in the example HTTP requests). In the course of a complex reconstruction involving biological experts, tool builders, theoreticians, and proofreaders and their managers, we can wind up with a lot of data. The snapshot below shows a portion of our current “hemibrain” reconstruction data. (Don’t worry about the specifics, just note the number of data instances that arise naturally).
 The keyvalue data type is the simplest one, allowing you to store and retrieve a blob of data in any format you choose. It can be used as a versioned file system and our team frequently uses it to store JSON, a simple and easily parsed data format. If some data is used by many clients and needs to support more sophisticated operations, we can create a new data type informed by real-world needs, adding to the Connectomics API.
Proofreading frequently requires examining and modifying the neuron segmentation in a number of ways. The screenshot below, taken from the Neuroglancer client, shows 2D planes integrating information from the grayscale and segmentation as well as the surfaces of selected neurons.
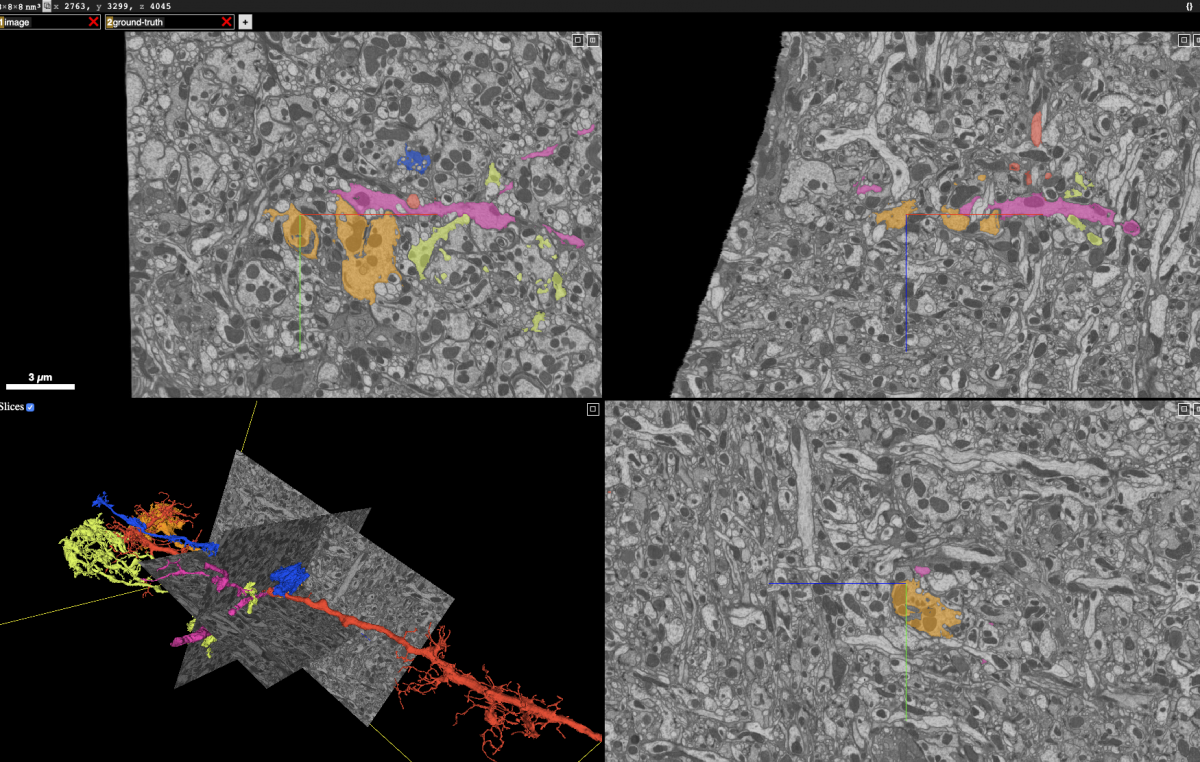
To compose this view, Neuroglancer needs to rapidly retrieve the grayscale and segmentation within those 2D rectangles and some representation of the neuron surfaces, whether it’s 3D meshes (in this case) or a list of surface voxels. Typically, to be sufficiently fast for interactive display, the segmentation data must be stored in at least two ways: (1) small blocks that allow fast retrieval of all neurons that intersect the 2D planes, and (2) a compact representation of each neuron’s surface. Storing segmentation in multiple ways also means data management must modify all those representations for any change. If we merge two neuron fragments or cleave off an incorrectly attached segment, we need to modify data held as small blocks as well as the neuron mesh and any other surface representation.
We see from the above, that client requirements often dictate how we store data. If we were to only provide access to blocks of segmentation, it would probably take too long to quickly retrieve a surface for any chosen neuron because we’d have to examine all intersecting blocks instead of simply retrieving precomputed data like a mesh.
Sometimes these client requirements could dictate storing data in very different storage systems. Some data, like the 3D points denoting synapses, tend to take much less storage than the grayscale or segmentation volume while requiring very quick random reads on small pieces of data. This suggests serving synapses from an embedded database on a relatively small but very fast SSD. Massive unchanging data like the grayscale image volume require initial writing, frequent reading, and very large capacity stores, which can be handled by the Google and Amazon cloud storage services. DVID uses a simple key-value storage layer that can flexibly assign data to different stores across a spectrum of scalability, cost, and speed.
For proofreading, we store neuron geometry and their connections as massive segmentation volumes and over 70 million 3D points with associated data. However, when it comes to analysis, we’d like rapid responses to complex queries on a simpler connectome graph of neurons and their connections. Graph databases (in contrast to the key-value stores that hold most of our data) are tuned for just these kinds of queries.
While we want to present a relatively unified Science API to clients, those API requests could be handled by very different databases on the backend and that raises some issues. Let’s say we merge two neurons and the change is applied immediately to a graph database used for analysis. In the meantime, proofreaders could be making a change to one of those merged neurons through DVID and its underlying key-value store. We have two problems: (1) there could be a conflict between the simultaneous changes, and (2) how do we make sure the graph database and the key-value store behind DVID are appropriately synchronized? The first is solved by having a separate tool that acts like a librarian, allowing clients to check out neurons and not allowing other clients to operate on them until they are checked back in. The second issue, though, only gets worse as we add specialized databases to our backend.
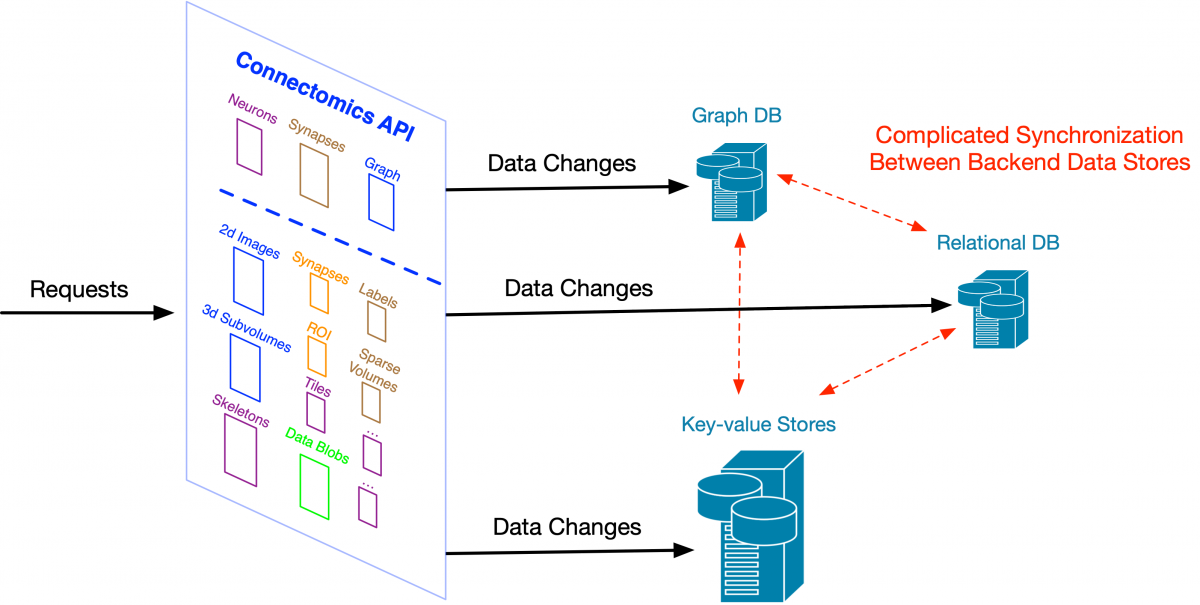 If we allow changes directly to each store behind our Connectomics API, as the number of stores increases, it becomes more complex to synchronize those changes across all our supported data systems. Large web companies ran into this problem many years ago. One solution -- change data capture and its more extreme form, the kappa architecture -- was first popularized by engineers at LinkedIn and is now used at large scale in companies like Facebook and Yahoo. It starts with the concept of a change log – a simple linear recording of how data is changed. Rather than directly modifying a variety of specialized databases and then trying to reconcile them, we store high-level descriptions of the changes (e.g., neuron fragment merges) to a robust log that can be used to update all downstream data stores like our Neo4j graph database.
 The concept of a change log is quite useful for the broader community. By agreeing upon a format for capturing high-level changes, we could use this change log to synchronize data across very different connectomics ecosystems.
Hopefully this post has given you an overview of how we handle connectomics data and the underlying databases. If there’s one takeaway, it should be that our approach values flexibility. The Connectomics API makes it easy for a rich set of tools to access our versioned data and add new data instances or even data types/APIs when necessary. DVID’s simple key-value backend lets us assign different types of data to well-matched storage systems with the appropriate scalability, speed, and cost. The concept of a change log lets us synchronize specialized databases and possibly external ecosystems with a given version of data. We haven’t discussed the last and perhaps most important example of flexibility: distributed versioning and the ability to easily create branches of versioned data. The FlyEM team has been developing new ways to handle collaborative editing in connectomics, inspired by highly successful systems like github.com, and we’ll be sharing our vision and tools for this in future posts.