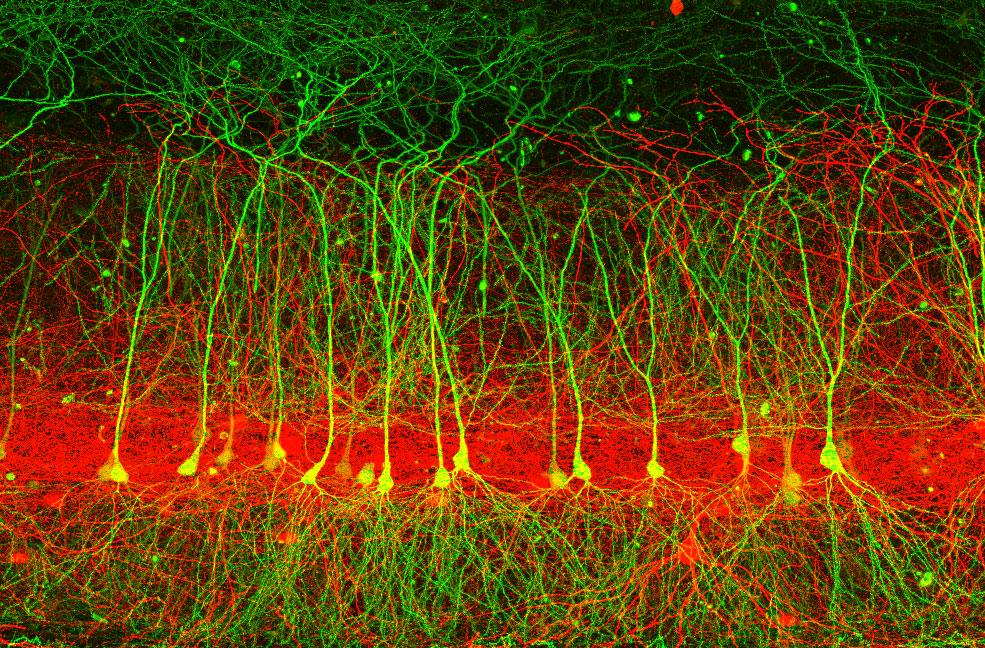
Pyramidal neuron dendrites are bombarded with inputs not only from excitatory synapses but also by inhibitory synapses from a variety of interneuron subtypes. Although electron microscopy has been used to estimate the total number of inhibitory inputs onto different dendritic compartments in CA1 pyramidal neurons (Megias et al., 2001), the number and location of synapses originating from different types of interneurons has not been determined. Providing an accurate picture of interneuron innervation of CA1 dendrites is important, because different types of interneurons are activated under different conditions, and the number and location of their inputs will influence the effect of each type on dendritic integration
To determine precisely where in the dendritic tree each type of synapse is formed, we are using array tomography, a form of light microscopy that provides diffraction-limited resolution, yet can be applied to large volumes (Micheva et al., 2007). Erik Bloss has succeeded in imaging several large volumes containing nearly the entirety of the CA1 dendritic tree, combined with labeling of inhibitory interneuron subtypes in order to determine the number and location of their synapses on the dendritic tree.
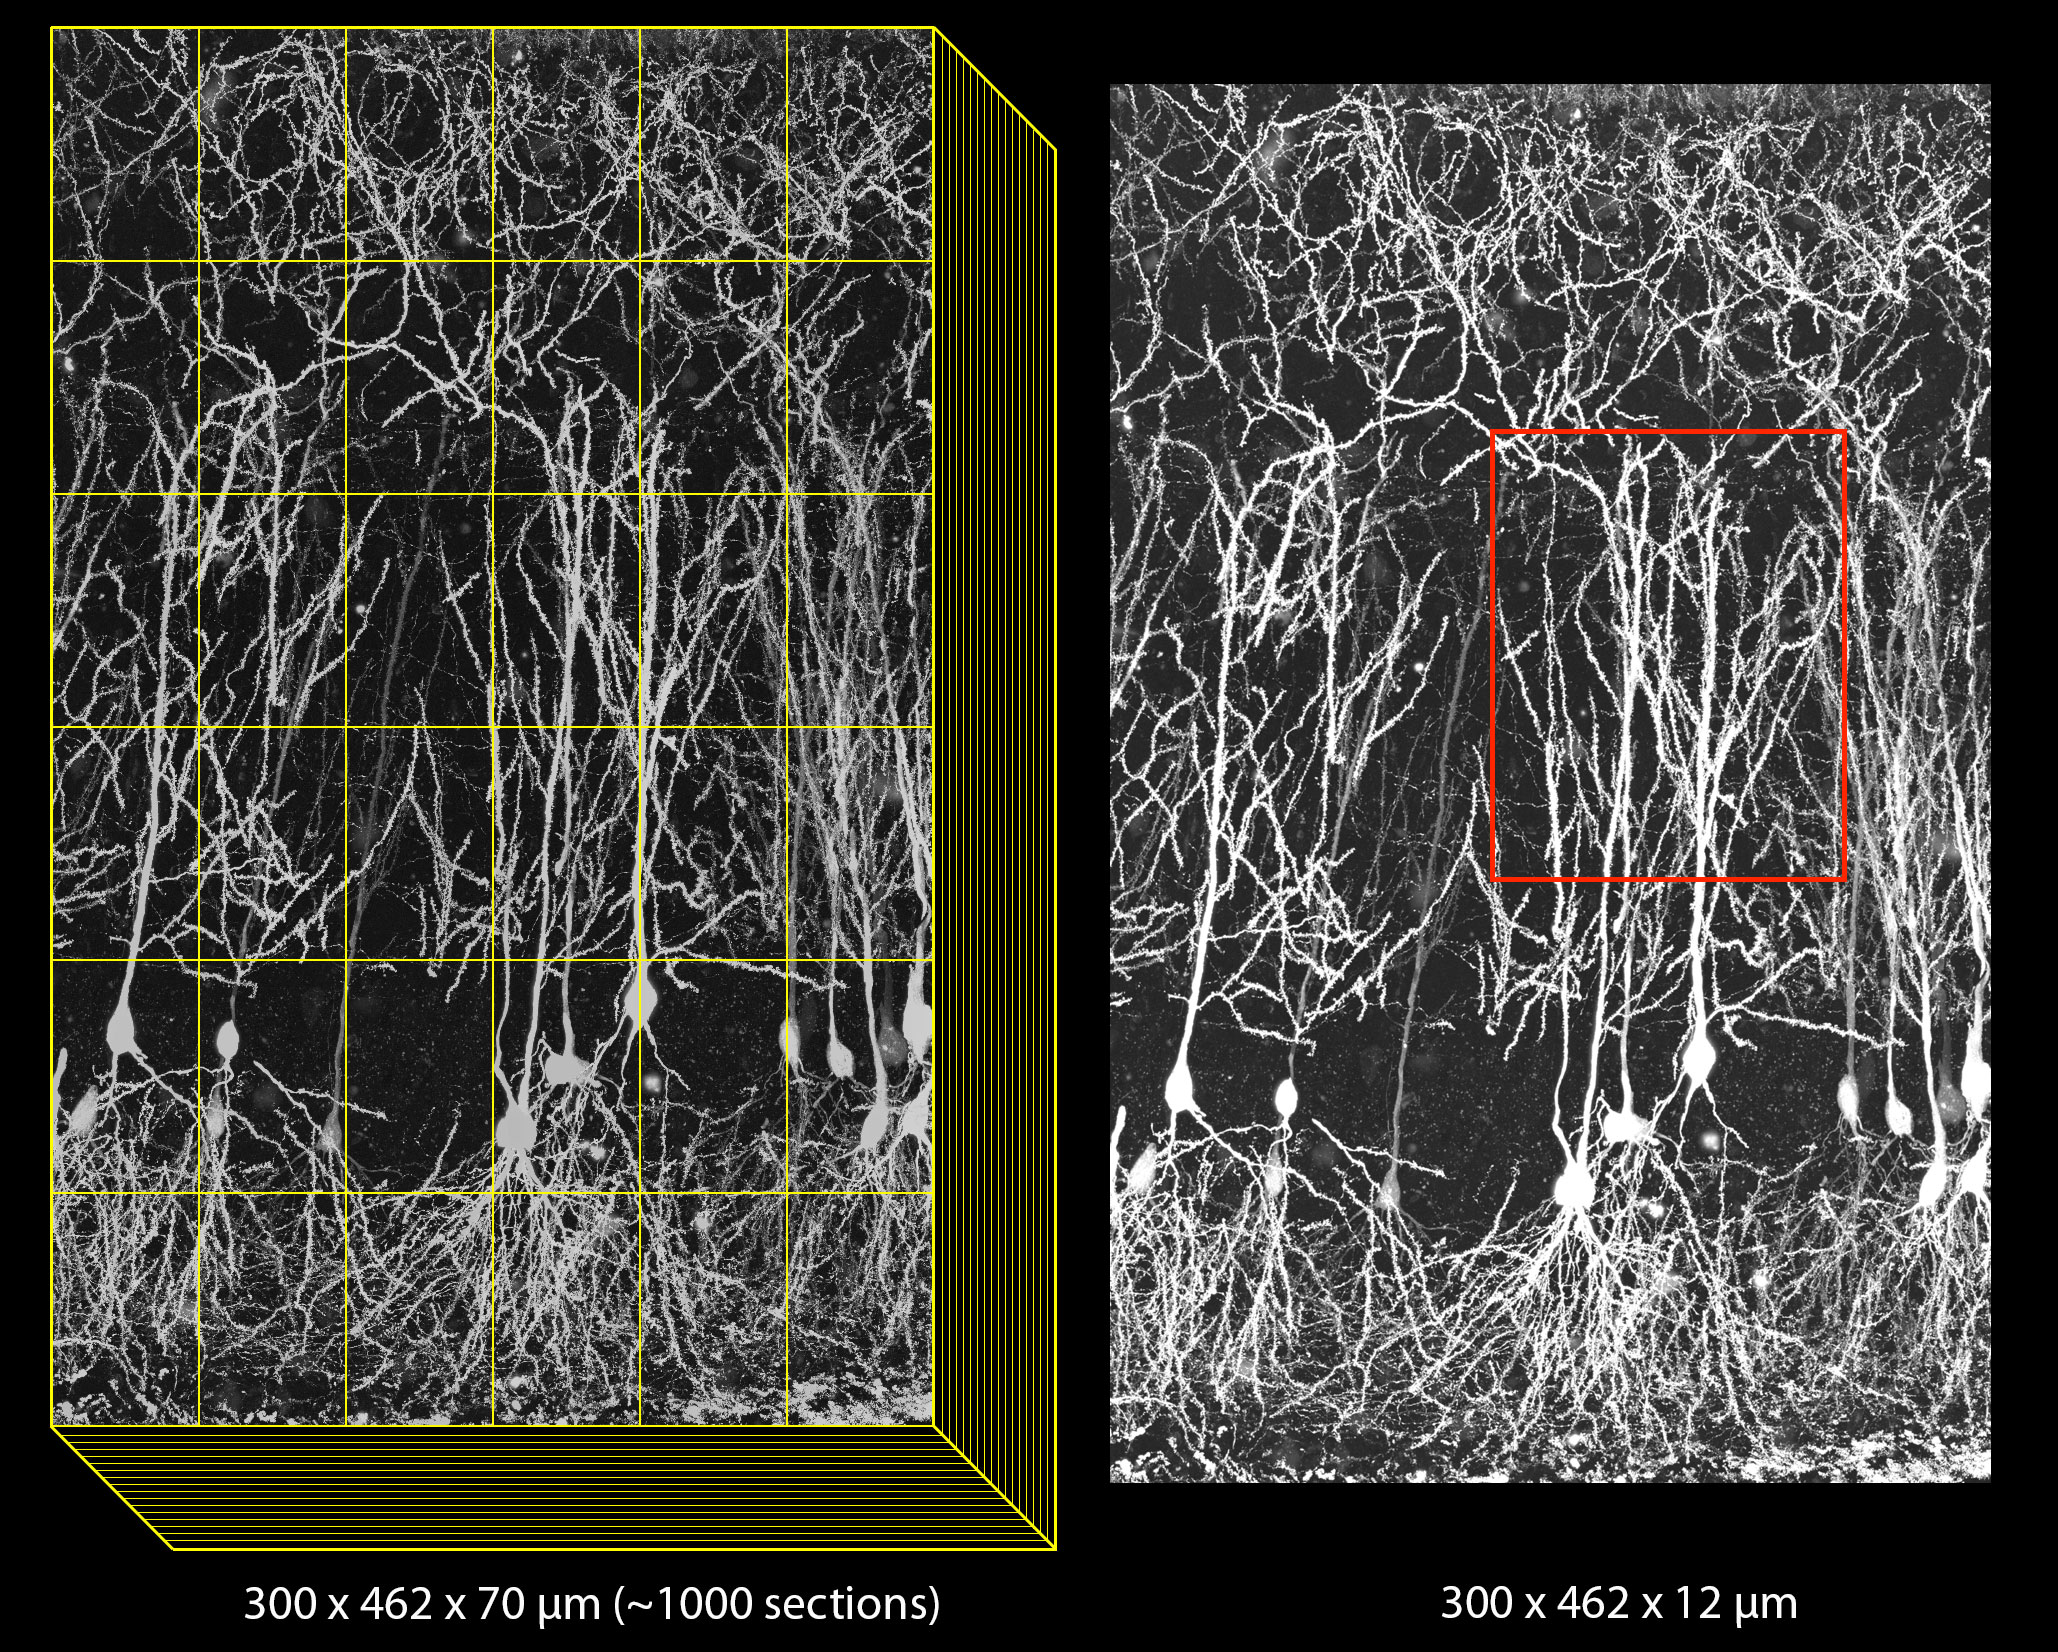
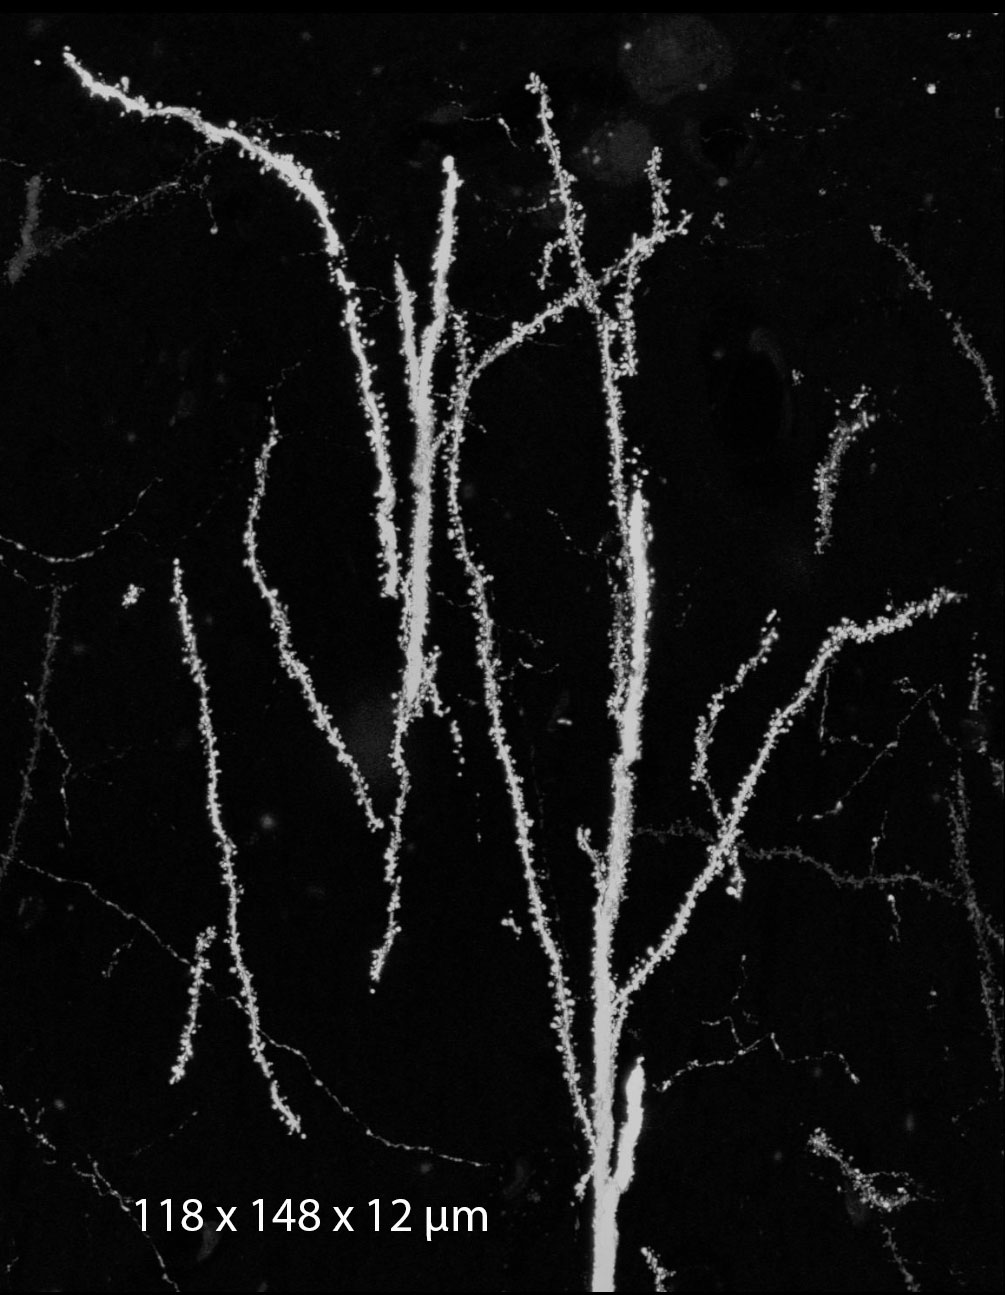
The basic approach with array tomography is to label neurons sparsely and prepare multiple ultrathin sections (70-100 nm) for imaging with wide-field light microscopy. Sections can be several hundred microns each in the XY dimensions, allowing for the full extent of the CA1 pyramidal neuron to be captured in each section by imaging multiple tiles. The full extent in Z can be captured provided that >1000 sections can be collected and imaged without loss. Images must be computationally stitched and aligned to generate 3D, high-resolution volumes.
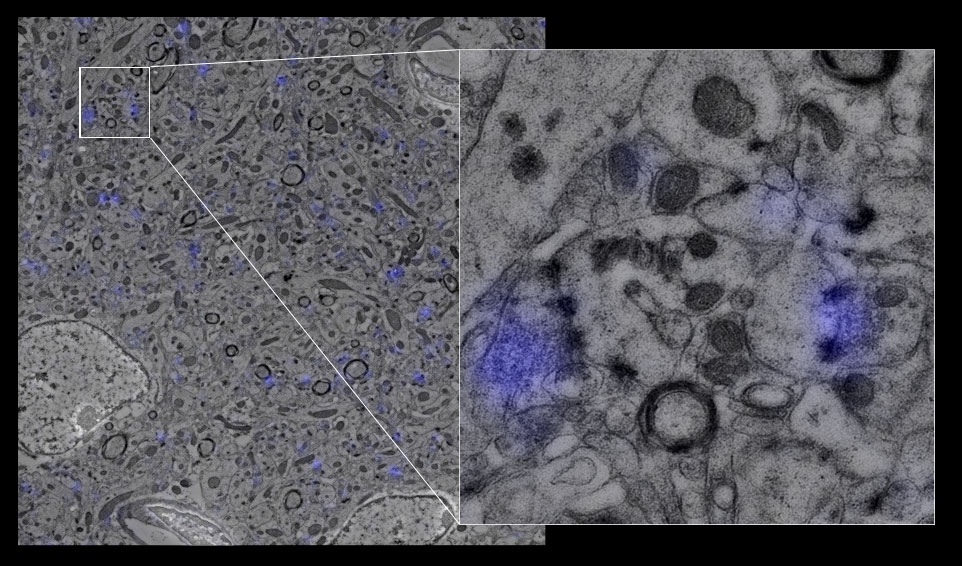
The high resolution provided by array tomography, combined with the ability to perform immunostaining of the ultrathin tissue sections, allows synapses to be identified by the colocalization of multiple markers in consecutive serial sections (see below: green=EGFP dendrite, blue=interneuron axon, white=synaptophysin). We have confirmed the existence of bona fide synapses at these regions by following array tomography with serial-section electron microscopy on the same sections (see below: blue=synaptophysin).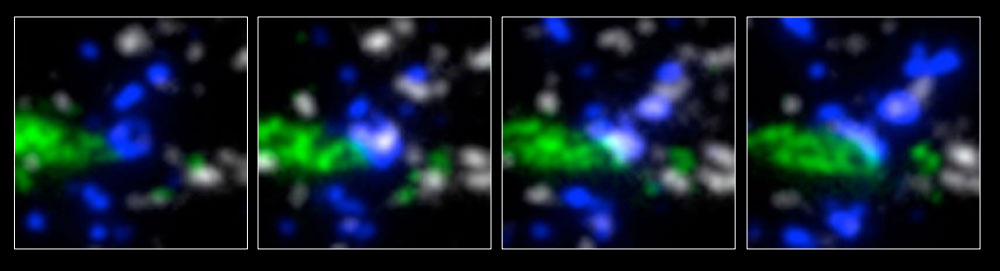
To date, we have fabricated and imaged several large arrays in this way (see Gallery, below) and we are analyzing the data to determine synapse numbers and locations for several different genetically defined subtypes of inhibitory interneurons. Erik Bloss has benefitted from the help of several people on this project, including Jennifer Colonell, Rick Fetter, Bill Karsch, and Sarada Viswanathan.
References
Megías M, Emri Z, Freund TF, Gulyás AI. Total number and distribution of inhibitory and excitatory synapses on hippocampal CA1 pyramidal cells. Neuroscience 102:527-40, 2001.
Micheva KD, Smith SJ. Array tomography: a new tool for imaging the molecular architecture and ultrastructure of neural circuits. Neuron 55:25-36, 2007.